
The visible impact of climate change on the Earth’s surface is often clearest in the Arctic’s receding glaciers and swelling glacial lakes. Southeastern Alaska’s Harlequin Lake is one of the fastest-growing in North America. These false color Landsat images show the rapidly-retreating Yakutat Glacier, which feeds the lake.
USGS at American Association of Geographers (AAG) 2022
By Communications and Publishing
February 25, 2022
Go for a 'stroll' as you scroll through the USGS AAG 2022 Virtual Conference Booth for the AAG 2022 Annual Meeting, Friday, February 25, 2022 - March 1, 2022. It's virtual this year! Since no one is staffing a physical booth, if you have any questions, then please feel free to Contact Us.
Jump to a topic
Mapping and Remote Sensing | Landsat | Land Change, Data Preservation, and More | Interactive Maps | Ecosystems | Education and More | Multimedia | Publications

Sources/Usage: Public Domain. View Media Details

Sources/Usage: Public Domain. View Media Details
Check out the National Cooperative Geologic Mapping Program (NCGMP)
The Program is the primary source of funds for the production of geologic maps in the United States and provides accurate geologic maps and three-dimensional framework models that help to sustain and improve the quality of life and economic vitality of the Nation and to mitigate natural hazards.

Sources/Usage: Public Domain. View Media Details

Sources/Usage: Public Domain. View Media Details
The mission of the National Geospatial Program is to provide National topographic information to advance science, support government, enlighten citizens, and enable decision making. The NGP provides a foundation of digital geospatial data representing the topography, natural landscape, and manmade environment of the United States. Accessible through The National Map Data Download, customers can incorporate NGP geospatial products and services into their decision-making and operational activities.
Visit Site | NGP User Engagement Office

Sources/Usage: Public Domain. View Media Details
| The National Map Training Videos |
The National Map Corps |
The National Digital Trails Project |

Sources/Usage: Public Domain. View Media Details
The USGS National Geospatial Technical Operations Center (NGTOC) provides leadership and world-class technical expertise in the acquisition and management of trusted geospatial data, services, and map products for the Nation. NGTOC supports The National Map as part of the National Geospatial Program (NGP).
Visit Site

Sources/Usage: Public Domain. View Media Details

Sources/Usage: Public Domain. View Media Details
Our Nation’s economic security and environmental vitality rely on continuous monitoring of the Earth’s continents, islands, and coastal regions in order to record, study, and understand land change at local, regional, and global scales. The USGS National Land Imaging (NLI) Program helps meet this need. This image is a portion of the first Landsat 8 scene acquired May 12, 2013, in Western Australia. The resulting image displays impressive sediment and nutrient patterns in the tropical estuary area, and the complex patterns and conditions in the vegetated areas.
Visit Site

Sources/Usage: Public Domain. View Media Details
At the USGS EROS Center, we study land change and produce land change data products used by researchers, resource managers, and policy makers across the nation and around the world. We also operate the Landsat satellite program with NASA and maintain the largest civilian collection of images of the Earth’s land surface in existence, including tens of millions of satellite images.
Learn More
Sources/Usage: Public Domain. View Media Details

Sources/Usage: Public Domain. View Media Details

Sources/Usage: Public Domain. View Media Details
Economic Valuation of Landsat imagery
Screenshot from "Using Landsat and Machine Learning to Map Urban Change"
| Landsat— Earth Observation Satellites |
Landsat 8 | Landsat 9 | Landsat Collections |
Landsat Collection 2 |
U.S. Landsat Analysis Ready Data |
Landsat Surface Reflectance Data |
|---|
Land Change, Data Preservation, and More
Sources/Usage: Public Domain. View Media Details
The referenced media source is missing and needs to be re-embedded.
Changes in the environment, land use, and climate can have significant impacts on our Nation’s economy, natural resources, infrastructure, and water, food, and energy security. To strengthen our Nation’s ability to respond and adapt to these stressors, the USGS Land Change Science Program conducts research to improve understanding of rates, causes, and consequences of climate and land-use change.
Visit Site

Sources/Usage: Public Domain. View Media Details
The Energy Policy Act of 2005 established the National Geological and Geophysical Data Preservation Program (NGGDPP) to preserve and expose the Nation’s geoscience collections (samples, logs, maps, data) to promote their discovery and use for research and resource development. The National Digital Catalog describes geoscience collections managed by USGS and state geological agencies.
Visit Site

Sources/Usage: Public Domain. View Media Details
We emphasize a science data lifecycle approach to Earth systems data and information. We strive to accelerate research and decision-making through data science, information delivery, advanced computing, and biodiversity analytics.
Visit Site

Sources/Usage: Public Domain. View Media Details

Sources/Usage: Some content may have restrictions. View Media Details

Sources/Usage: Public Domain. View Media Details
We serve as a catalyst for innovative thinking in Earth system science research by providing the time, creative space, and computational, data manipulation, and data management resources to promote the synthesis of existing information leading to emergent Earth System science knowledge.
Visit Site

Sources/Usage: Public Domain. View Media Details
Check out the USGS Library
Authorized by Congress in 1879, the U.S Geological Survey Library is recognized as one of the world’s largest Earth and natural science libraries, providing services, collections, and expertise essential to the USGS mission.
| USGS Library Catalog |
USGS Library Historical Photo Collection |
USGS Publications Warehouse |
USGS Library Guides |
|---|
Sources/Usage: Public Domain. View Media Details
Sources/Usage: Public Domain. View Media Details
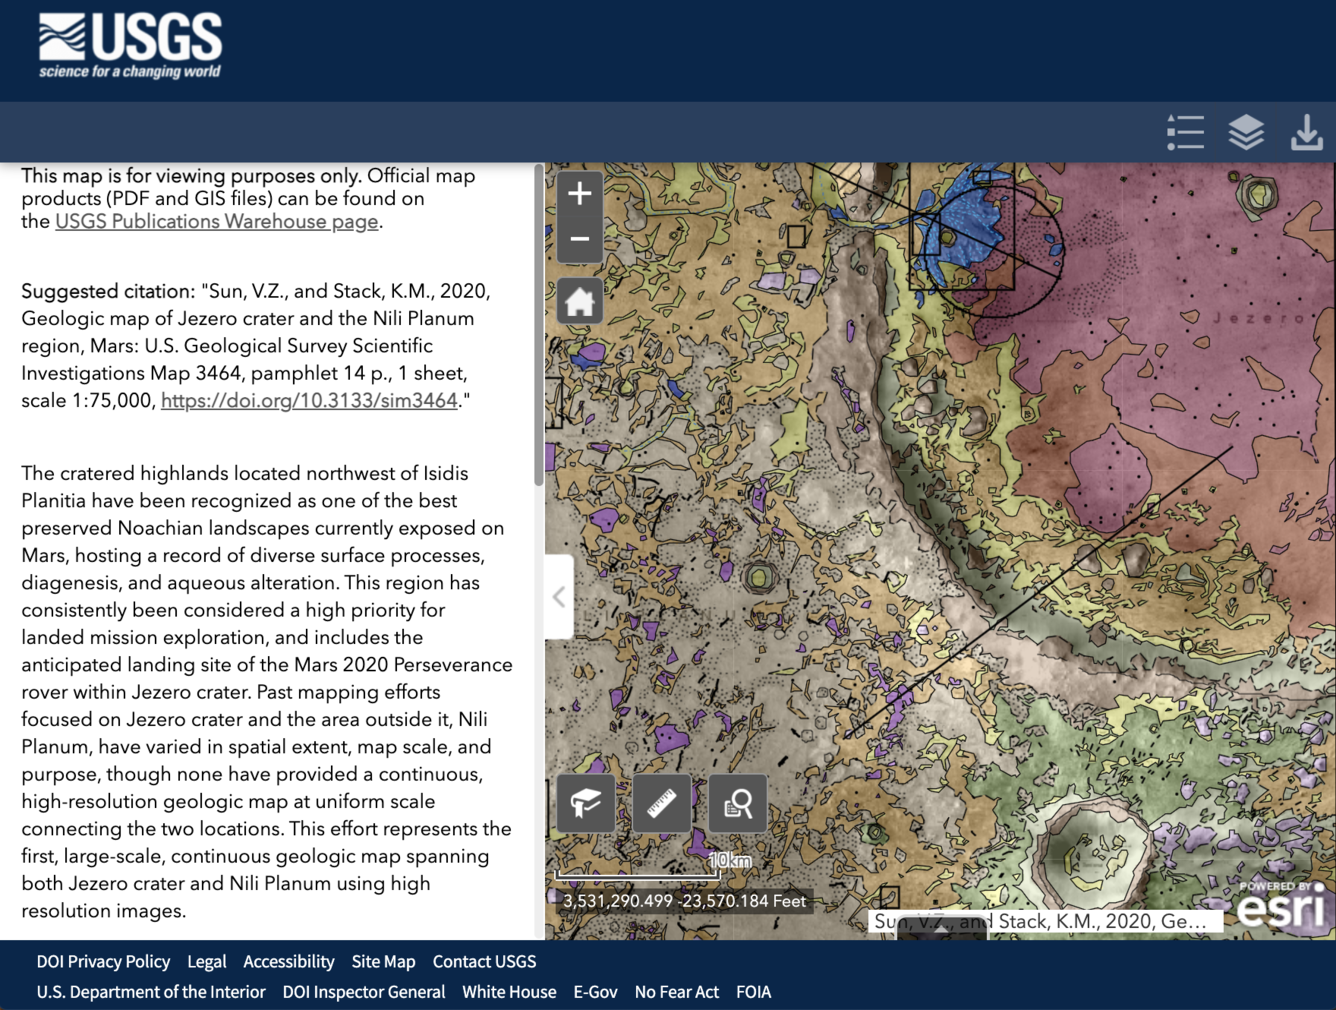
Interactive Map of Jezero Crater, Mars, the Perseverance Rover Landing Site
This effort represents the first, large-scale, continuous geologic map spanning both Jezero crater and Nili Planum using high-resolution images.

Sources/Usage: Public Domain. View Media Details
Mapping Phytoplankton and Nutrient Abundance in the San Francisco Estuary and Delta
Phytoplankton populations in estuaries such as San Francisco Bay, California is influenced by a host of local stresses that mask plankton responses to global climate change.

Sources/Usage: Public Domain. View Media Details
California's Exposure to Volcanic Hazards
Photograph of Lassen Peak viewed from the south at the summit of Brokeoff Volcano, Lassen Volcanic National Park.

Sources/Usage: Public Domain. View Media Details
Check out the Bay-Delta Regional Monitoring Program
We provide nutrient parameter maps, difference maps, water quality parameter maps, spatial changes in nutrients, phytoplankton maps, and more.

Sources/Usage: Some content may have restrictions. View Media Details
Bond Fire Debris Flows, California (Jan. 25 - 28, 2021)
Our post-fire debris-flow hazard assessment model returns estimates of likelihood, volume, and relative combined hazard in response to design storms with 15-minute (min) rainfall intensities ranging from 12 to 40 millimeters per hour (mm/h) in 4 mm increments.

Sources/Usage: Public Domain. View Media Details
The 2019 Ridgecrest, California Earthquake
USGS Response and Findings after the M6.4 on July 4 and M7.1 on July 6, 2019, in Searles Valley, Southern California.

Sources/Usage: Some content may have restrictions. View Media Details
Walker Basin Hydro Interactive Mapper
The Walker Basin Hydro Mapper provides a basin-wide perspective of real-time streamflow and stage as well as lake and reservoir storage capacity for the Walker River Basin in Nevada and California.
Sources/Usage: Public Domain. View Media Details
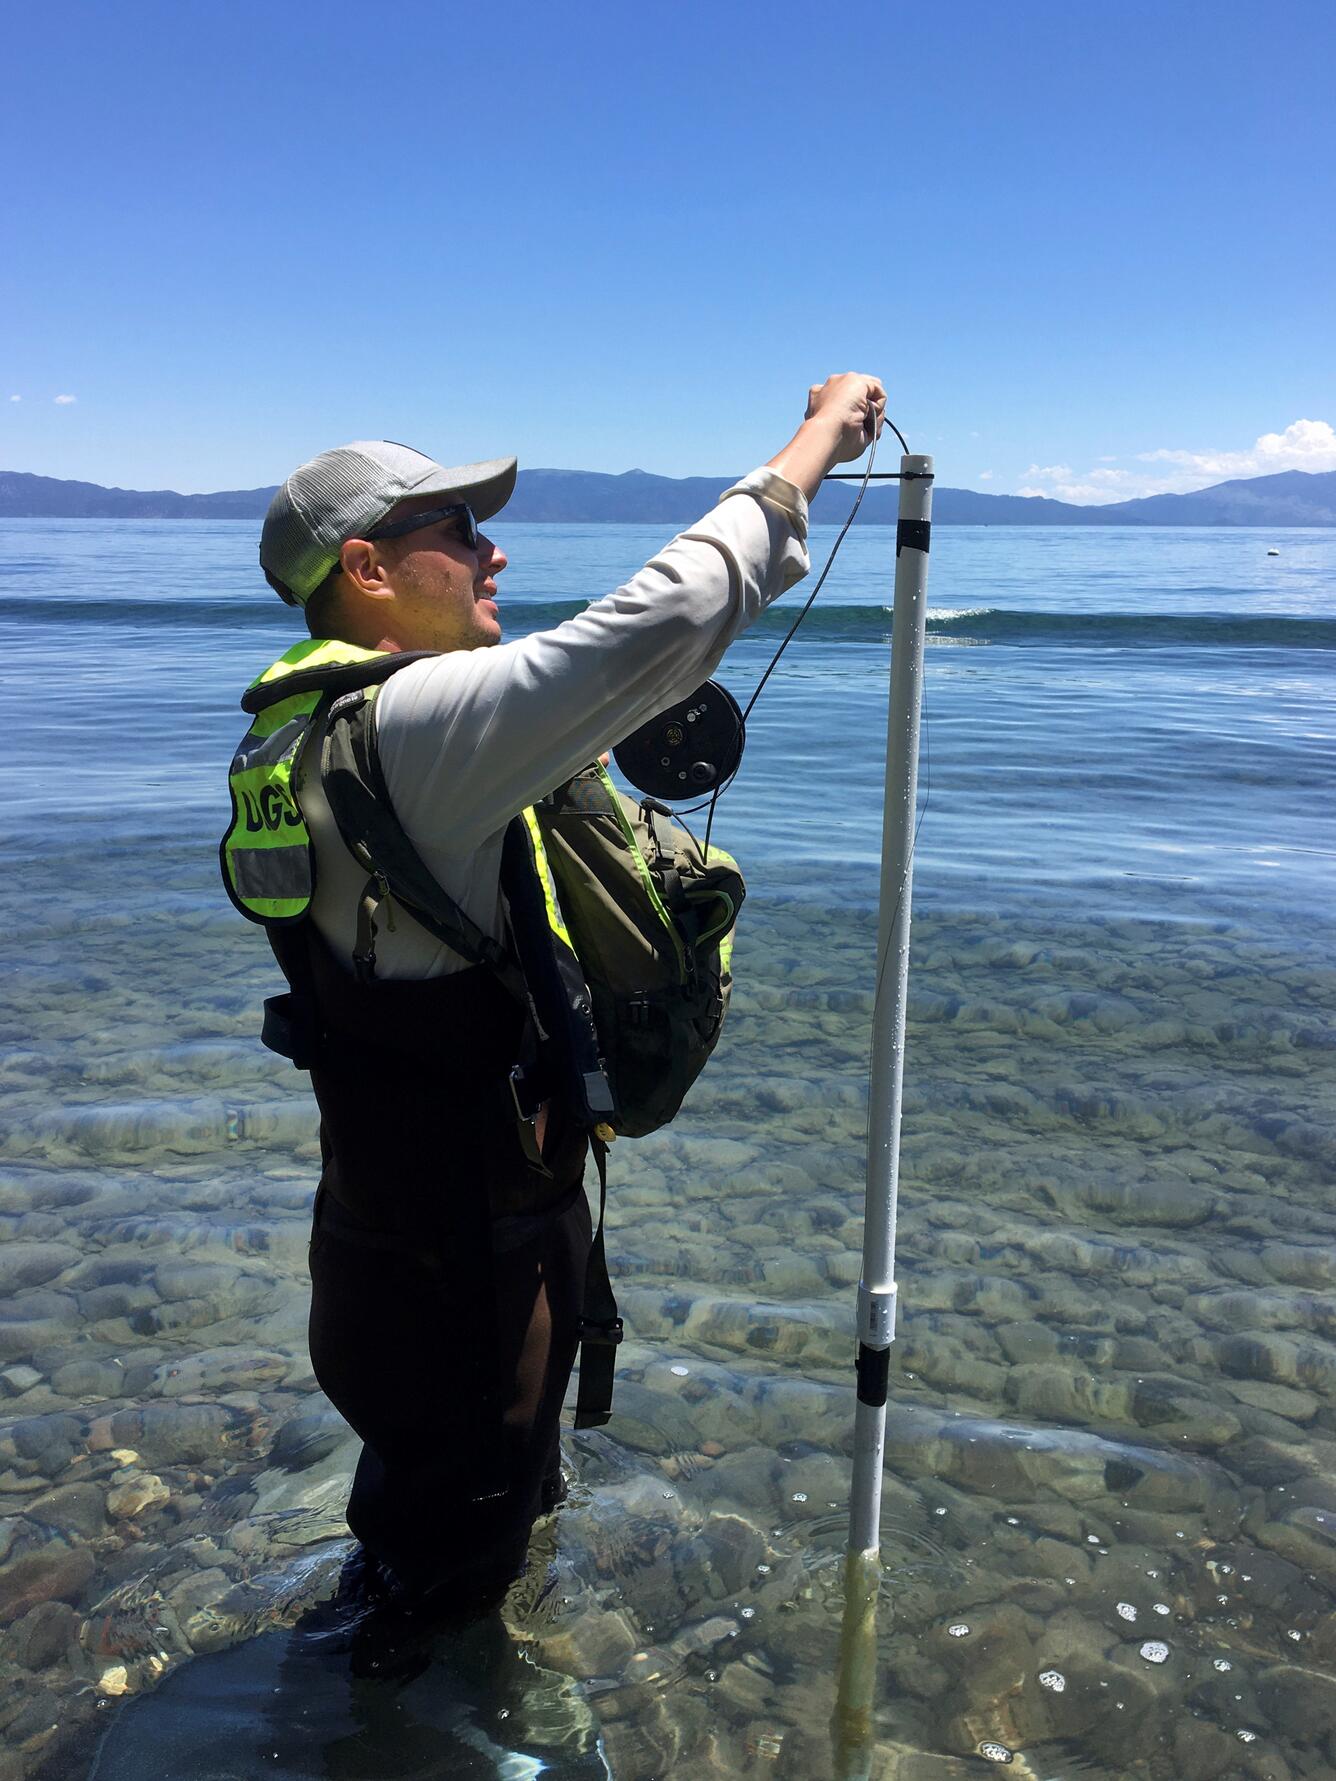
Lake Tahoe Basin Science
For decades, USGS has been a leader in a wide range of scientific research and monitoring activities in the Lake Tahoe Basin. Through this research, significant advances in understanding have been made about how sediment and nutrient sources affect water quality in the lake.
Sources/Usage: Public Domain. View Media Details

Sources/Usage: Public Domain. View Media Details

Sources/Usage: Public Domain. View Media Details
Chronic Wasting Disease Research by the USGS & Partners
The map above is the distribution of Chronic Wasting Disease in North America, updated on February 24, 2021.

Sources/Usage: Public Domain. View Media Details
USGS Nonindigenous Aquatic Species (NAS) Database Releases 500+ Alert Risk Maps
USGS Alert Risk Maps (ARMs) display lakes, the river reaches, and other water bodies potentially at risk of invasion by a new non-native species. The ARMs span the conterminous U.S.

Sources/Usage: Some content may have restrictions. View Media Details
New Maps Document Big-Game Migrations Across the Western United States
For the first time, state and federal wildlife biologists have come together to map the migrations of ungulates – hooved mammals such as mule deer, elk, pronghorn, moose, and bison – across America’s West. The maps will help land managers and conservationists pinpoint actions necessary to keep migration routes open and functional to sustain healthy big-game populations.
Sources/Usage: Public Domain. View Media Details

Sources/Usage: Public Domain. View Media Details

Sources/Usage: Public Domain. View Media Details

Sources/Usage: Public Domain. View Media Details

Sources/Usage: Public Domain. View Media Details

Sources/Usage: Public Domain. View Media Details
Check out all Internships and Employment Opportunities
The Youth and Education in Science team and the Human Resources team have created this space to share resources with people attending virtual meetings this fall and wanting to learn more about opportunities at USGS.


Sources/Usage: Public Domain. View Media Details
Check out Resources for Teachers
On the left, an example of a lidar image created from the “point cloud” that shows objects’ reflectivity near the Santa Cruz Beach Boardwalk and the mouth of the San Lorenzo River. On right, a digital still image overlaid onto the lidar “point cloud” data gives it a realistic 3D look. Download or purchase USGS maps and satellite imagery, geologic maps, land use, map-teaching resources, map tools, online maps of the US, thematic maps, topographic maps, and more.

Sources/Usage: Public Domain. View Media Details
Check out How to Construct a 3D Topographic Map
Objective: Students will be able to visualize a 2D map as a 3D feature understand why topographic lines never intersect interpret the shape of topographic features.

Sources/Usage: Public Domain. View Media Details
Check out Topographic Map Resources for Teachers
This directory level site includes links to various resources on topographic maps, how to obtain them, read them, their history, and map projections and includes links to various teaching activities and modules. It is the one-stop-shop for learning about, using, and teaching topographic map concepts.

Sources/Usage: Public Domain. View Media Details
Coloring activity: Explore Jezero Crater with the Mars 2020 Perseverance Rover
On February 18, 2021, the Mars 2020 Perseverance rover will land in the Jezero crater and begin its search for signs of previous life on Mars. You can help the Perseverance rover explore its new home with the Jezero crater coloring activity!
Related Content

Image of the Week: Glacial Retreat Fills Alaska Lake
The visible impact of climate change on the Earth’s surface is often clearest in the Arctic’s receding glaciers and swelling glacial lakes. Southeastern Alaska’s Harlequin Lake is one of the fastest-growing in North America. These false color Landsat images show the rapidly-retreating Yakutat Glacier, which feeds the lake.

Image of the Week - Fires Tear Through Former Cane Fields
The waves of sugar cane that once defined the Hawaiian island landscape of Maui, have slowly given way to non-native annual grasses in recent decades. Those grasses have become a fire hazard along the way.
The waves of sugar cane that once defined the Hawaiian island landscape of Maui, have slowly given way to non-native annual grasses in recent decades. Those grasses have become a fire hazard along the way.

Image of the Week - Iowa Fields Flattened
The punishing derecho storm that struck the Midwest in early August had an immediate impact on Iowa's farm fields. But it took weeks for the long term damage to appear in satellite imagery. Landsat 8 passed over central Iowa just one day after 100 mile per hour winds pummeled fields of corn and soybeans leaving thousands without power.
The punishing derecho storm that struck the Midwest in early August had an immediate impact on Iowa's farm fields. But it took weeks for the long term damage to appear in satellite imagery. Landsat 8 passed over central Iowa just one day after 100 mile per hour winds pummeled fields of corn and soybeans leaving thousands without power.

Image of the Week - Summer Fires Rage in California
As fire season continues in the western United States let's look back at a number of incidents tracked by officials across California in August. These fires were captured during the day by Landsats 7 and 8, in natural color bands of the visible spectrum. Landsat sensors also record infrared wavelengths revealing burn scars and active fires.
As fire season continues in the western United States let's look back at a number of incidents tracked by officials across California in August. These fires were captured during the day by Landsats 7 and 8, in natural color bands of the visible spectrum. Landsat sensors also record infrared wavelengths revealing burn scars and active fires.

Image of the Week - Virtual Road Trip with Landsat
Summer vacation plans changed for many in 2020. Whatever your plans, Landsat can take you on a virtual road trip. Landsat 8, in its sun-synchronous polar orbit, views every national park in the U.S. every 16 days and gathers more photographic data than the most ambitious of tourists.
Summer vacation plans changed for many in 2020. Whatever your plans, Landsat can take you on a virtual road trip. Landsat 8, in its sun-synchronous polar orbit, views every national park in the U.S. every 16 days and gathers more photographic data than the most ambitious of tourists.

Image of the Week - London Bridge in Arizona
London Bridge was indeed falling down. Set to be torn apart and replaced in the 1960s, this bridge across the River Thames was purchased by businessman Robert McCulloch in April 1968 and shipped across the Atlantic, to Lake Havasu City, Arizona, billed as the world's largest antique.
London Bridge was indeed falling down. Set to be torn apart and replaced in the 1960s, this bridge across the River Thames was purchased by businessman Robert McCulloch in April 1968 and shipped across the Atlantic, to Lake Havasu City, Arizona, billed as the world's largest antique.
Related Content
Image of the Week: Glacial Retreat Fills Alaska Lake
The visible impact of climate change on the Earth’s surface is often clearest in the Arctic’s receding glaciers and swelling glacial lakes. Southeastern Alaska’s Harlequin Lake is one of the fastest-growing in North America. These false color Landsat images show the rapidly-retreating Yakutat Glacier, which feeds the lake.
The visible impact of climate change on the Earth’s surface is often clearest in the Arctic’s receding glaciers and swelling glacial lakes. Southeastern Alaska’s Harlequin Lake is one of the fastest-growing in North America. These false color Landsat images show the rapidly-retreating Yakutat Glacier, which feeds the lake.
Image of the Week - Fires Tear Through Former Cane Fields
The waves of sugar cane that once defined the Hawaiian island landscape of Maui, have slowly given way to non-native annual grasses in recent decades. Those grasses have become a fire hazard along the way.
The waves of sugar cane that once defined the Hawaiian island landscape of Maui, have slowly given way to non-native annual grasses in recent decades. Those grasses have become a fire hazard along the way.
Image of the Week - Iowa Fields Flattened
The punishing derecho storm that struck the Midwest in early August had an immediate impact on Iowa's farm fields. But it took weeks for the long term damage to appear in satellite imagery. Landsat 8 passed over central Iowa just one day after 100 mile per hour winds pummeled fields of corn and soybeans leaving thousands without power.
The punishing derecho storm that struck the Midwest in early August had an immediate impact on Iowa's farm fields. But it took weeks for the long term damage to appear in satellite imagery. Landsat 8 passed over central Iowa just one day after 100 mile per hour winds pummeled fields of corn and soybeans leaving thousands without power.
Image of the Week - Summer Fires Rage in California
As fire season continues in the western United States let's look back at a number of incidents tracked by officials across California in August. These fires were captured during the day by Landsats 7 and 8, in natural color bands of the visible spectrum. Landsat sensors also record infrared wavelengths revealing burn scars and active fires.
As fire season continues in the western United States let's look back at a number of incidents tracked by officials across California in August. These fires were captured during the day by Landsats 7 and 8, in natural color bands of the visible spectrum. Landsat sensors also record infrared wavelengths revealing burn scars and active fires.
Image of the Week - Virtual Road Trip with Landsat
Summer vacation plans changed for many in 2020. Whatever your plans, Landsat can take you on a virtual road trip. Landsat 8, in its sun-synchronous polar orbit, views every national park in the U.S. every 16 days and gathers more photographic data than the most ambitious of tourists.
Summer vacation plans changed for many in 2020. Whatever your plans, Landsat can take you on a virtual road trip. Landsat 8, in its sun-synchronous polar orbit, views every national park in the U.S. every 16 days and gathers more photographic data than the most ambitious of tourists.
Image of the Week - London Bridge in Arizona
London Bridge was indeed falling down. Set to be torn apart and replaced in the 1960s, this bridge across the River Thames was purchased by businessman Robert McCulloch in April 1968 and shipped across the Atlantic, to Lake Havasu City, Arizona, billed as the world's largest antique.
London Bridge was indeed falling down. Set to be torn apart and replaced in the 1960s, this bridge across the River Thames was purchased by businessman Robert McCulloch in April 1968 and shipped across the Atlantic, to Lake Havasu City, Arizona, billed as the world's largest antique.
Get Our News
These items are in the RSS feed format (Really Simple Syndication) based on categories such as topics, locations, and more. You can install and RSS reader browser extension, software, or use a third-party service to receive immediate news updates depending on the feed that you have added. If you click the feed links below, they may look strange because they are simply XML code. An RSS reader can easily read this code and push out a notification to you when something new is posted to our site.