
Example initial analyses on the water temperature data
By Yellowstone Volcano Observatory
2021 (approx.)

Detailed Description
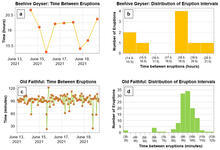
Example initial analyses on the water temperature data. (a, c) Graphs showing the calculated time between eruptions. (b, d) Histograms demonstrating the distribution of eruption intervals. Given this single week in June, we observe that Beehive Geyser erupted in a bi-modal fashion, preferring ~15 hour and ~19 hour intervals, while Old Faithful shows a unimodal trend with a mean of ~97 minutes.
Sources/Usage
Public Domain.