
January 4, 2021, Below Normal Groundwater Levels Network

Detailed Description
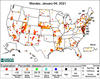
Map indicates groundwater sites within the USGS Active Groundwater Level network where the most recent groundwater-level measurement is in the 24th percentile or lower in the month of measurement over the period of record for the well. For more information about what wells are included or to view data, visit the Below Normal Groundwater Levels Network.
Sources/Usage
Public Domain.
Below Normal Groundwater Levels Network
A well with below normal groundwater levels is identified on these pages when the most recent water-level measurement is in the 24th percentile or lower in the month of measurement over the period of record for the well. To be included on this map in red or orange, the well must be in an active measurement program (the well appears on the Active Groundwater Level Network) and the well must have 10 or more years of record in the month of the most recent measurement. These web pages present all active wells, regardless of measurement frequency, aquifer monitored, or the monitoring objective.
All wells in the Active Groundwater Level network are presented on the National map for context. The symbol colors for wells in which the most recent water level is greater than the 24th percentile are muted in order to focus on the below normal groundwater levels. The underlying state and county maps present only those wells in which the most recent measurement is below normal.