
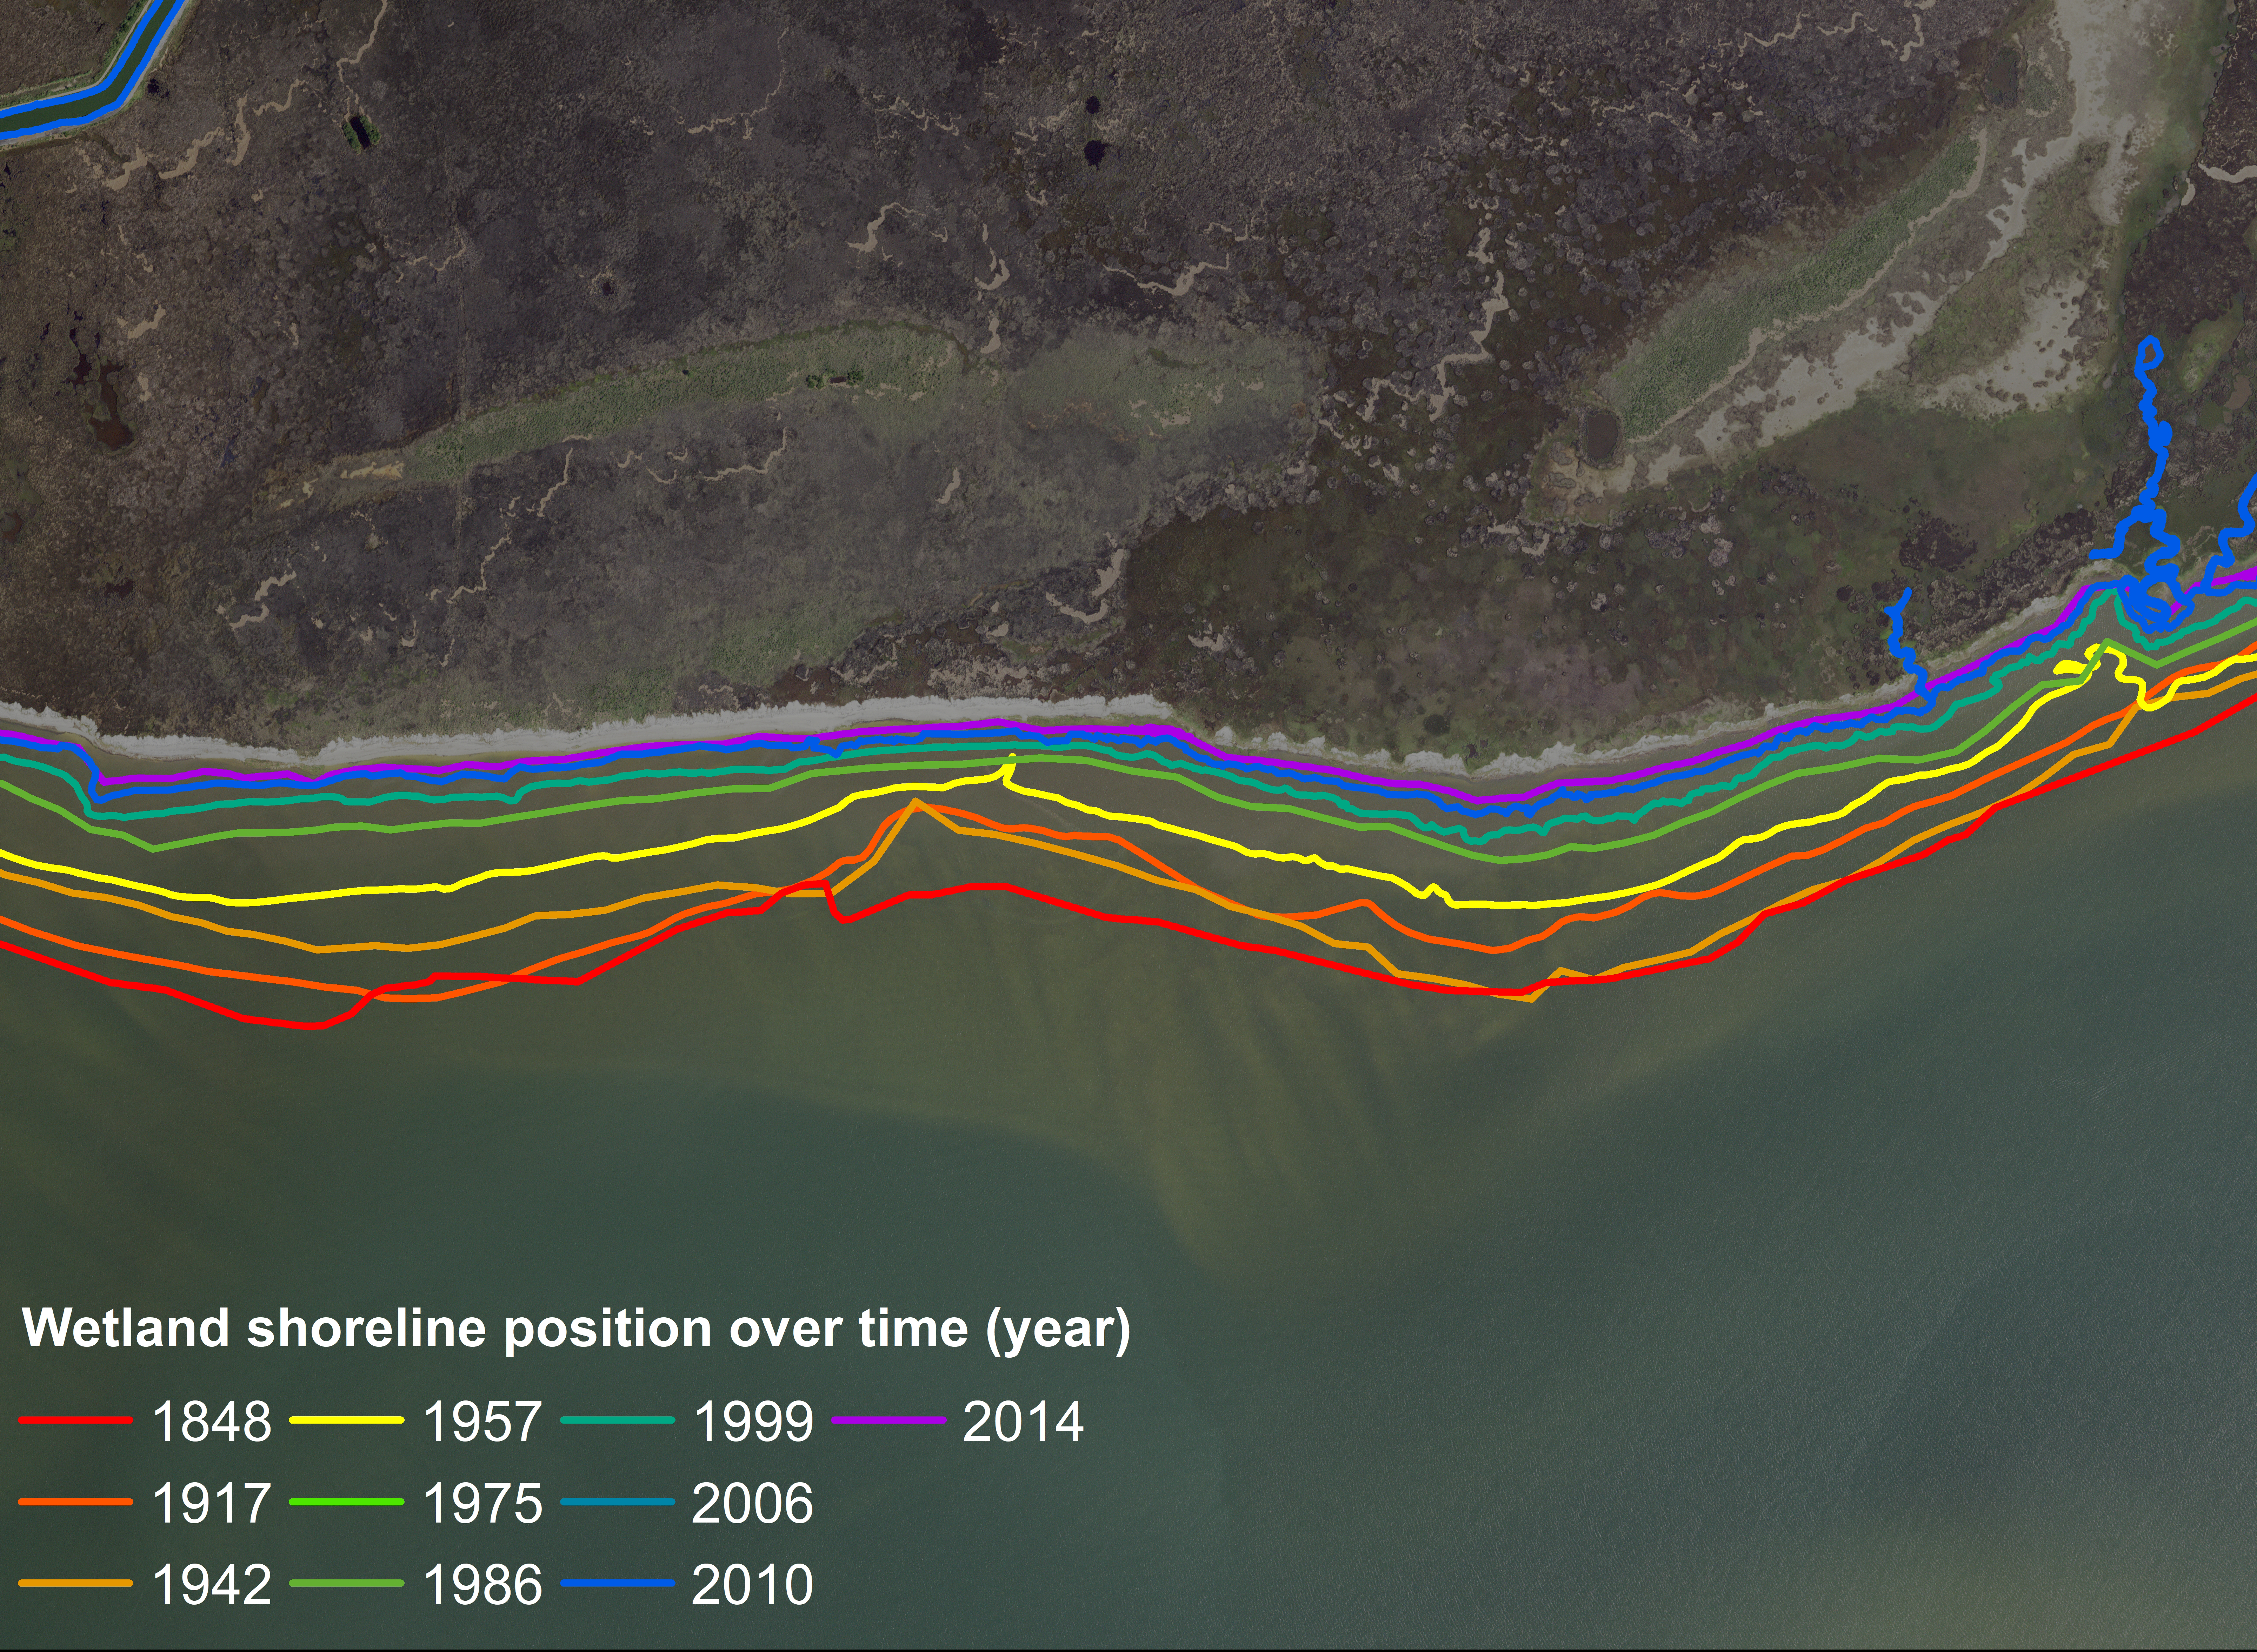
Mapped shoreline position from 1848 to 2014 overlaid on 2020 U.S. Department of Agriculture (USDA) National Aerial Imagery Program (NAIP) natural-color aerial imagery provide evidence of coastal wetland change over time

Detailed Description
Coastal wetland shoreline position is mapped from historic and modern data sources, such as topographic sheets, aerial imagery, and satellite imagery. From these data, the shoreline change rate is determined from the date of the data source and the distance between each shoreline. Shoreline change rates provide critical information to coastal land managers, scientists, and decision-makers on shoreline erosion or accretion rates and the impact of sea level rise, storms, and other erosion hazards on coastal habitats and communities. This image provides an example of the digitally mapped shoreline position from 1848 to 2014 for a section of shoreline in Point Aux Chenes Bay, Mississippi, a section of shoreline within the Grand Bay National Estuarine Research Reserve, overlaid on natural-color aerial imagery from 2020 collected by the U.S. Department of Agriculture (USDA) National Aerial Imagery Program (NAIP). The image provides an example of how multiple dated shoreline data provide evidence of coastal wetland erosion over time.
Sources/Usage
Public Domain.