
Seismic data coverage of the Yellowstone region and example of seismic noise records

Detailed Description
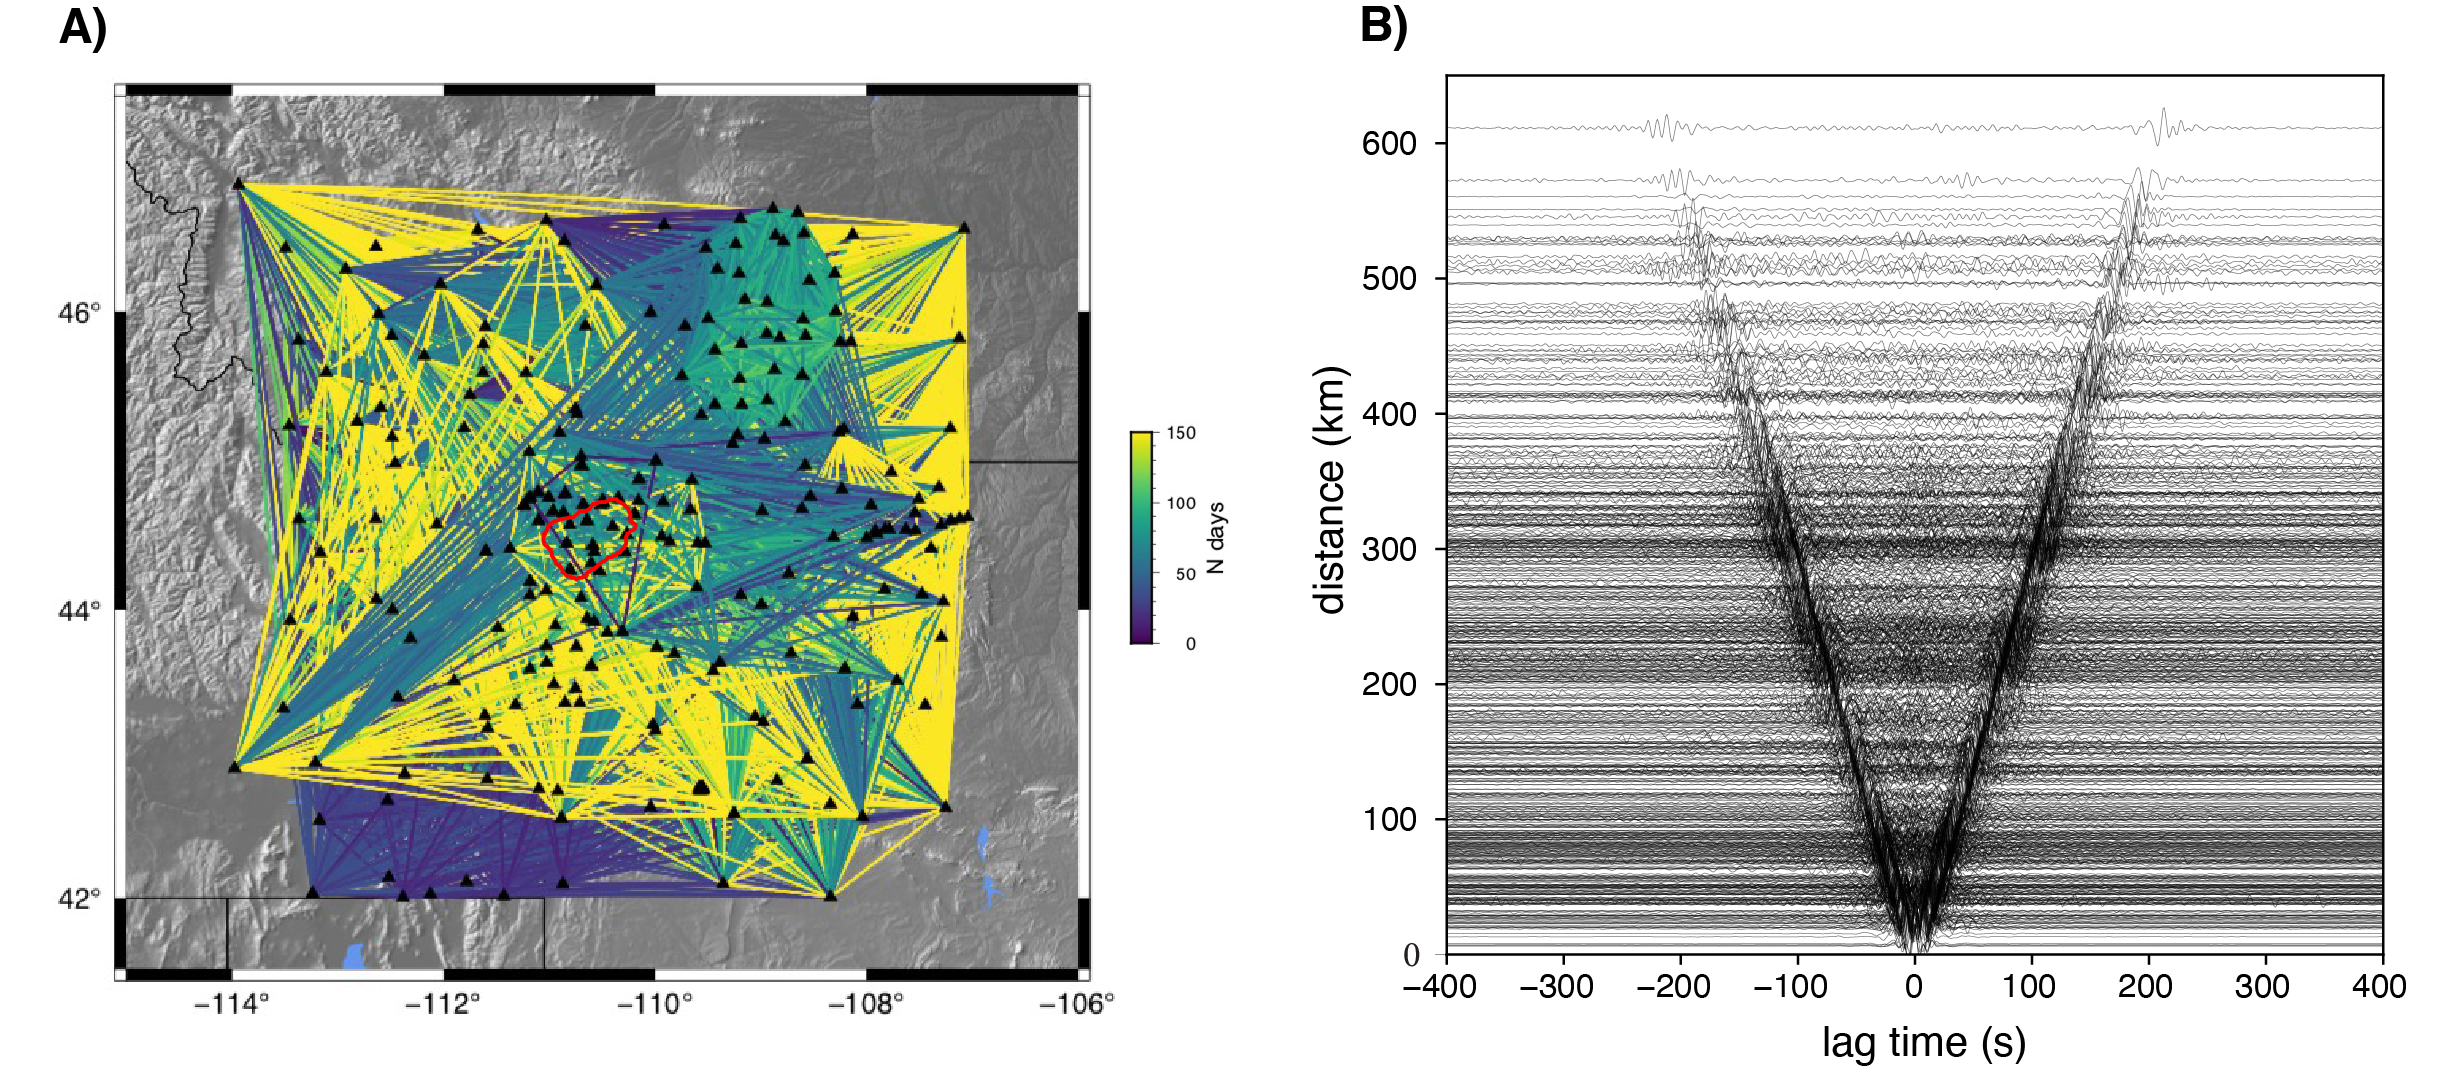
Seismic data coverage of the Yellowstone region and example of seismic noise records. By cross-correlating signals of the background noise recorded at two seismic stations and stacking the signals over many days, useful seismic waveforms can be extracted. Panel A shows a map of permanent and temporary broadband seismometers in the Yellowstone region deployed between 1999 and 2019 as black triangles. Colored lines between station pairs show there is dense coverage of Yellowstone Caldera (red outline), which allows for calculation of seisic wave speed in the subsurface. Lines are colored by the number of days during which both stations were recording (blue is few days, yellow is many days). Panel B shows the signals extracted from the seismic noise records, which represent seismic waves known as Rayleigh waves traveling between stations. Data like these are used to calculate wave speeds below the surface and develop a map that can provide insights into the presence of magma.
Sources/Usage
Public Domain.