Satellite Data Used to Estimate and Rank Cyanobacterial Bloom Magnitude in Florida and Ohio Lakes—Developing Tools to Protect Human and Wildlife Health from Cyanotoxin Exposure
Tool Developed to Estimate Cyanobacteria Bloom Magnitude
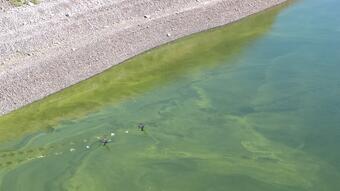
Near-shore Algal Bloom
Remotely Sensed Data are Used to Estimate Algal Bloom Characteristics
Cyanobacterial bloom magnitude during 2003–11 was quantified and ranked in Florida and Ohio lakes with a newly developed modelling tool that allows for the use of multiple satellite data sources and user-defined thresholds. This tool was designed to identify the magnitude of algal blooms, but one metric alone cannot adequately represent the severity of a bloom of interest in terms of toxicity. The combination of this tool with other measures such as bloom frequency, bloom area, and in-lake toxin concentrations, along with advances in satellite data availability, represents an incremental step toward the development of decision tools used to protect health of wildlife and the public from algal toxin exposures.

Cyanobacteria are a perceived global environmental and public health issue, primarily due to their ability to produce toxins. The ability of cyanobacteria to release toxins is well known; however, many fundamental questions remain about the timing and triggers of toxin release. Algal toxins have been associated with adverse human health issues including gastrointestinal distress, dermatitis, or liver failure, and the possible death of pets and livestock that are exposed to water containing toxins. Cyanobacteria within visible algal blooms do not always produce toxins. However, depending on the cyanobacteria present, blooms have the potential to produce toxins and thus bloom presence is often used as an indicator of toxin presence.
To understand the potential health hazards associated with exposure to algal toxins, water managers have expressed the need for tools to determine bloom magnitude for monitoring the status of cyanobacteria in inland lakes and reservoirs. Tools have been previously developed to quantify the biomass of cyanobacteria blooms, but not for quantifying bloom magnitude. Therefore, the U.S. Geological Survey (USGS) Toxins and Harmful Algal Blooms Science Team collaborated with the National Oceanic and Atmospheric Administration (NOAA), U.S. Environmental Protection Agency (EPA), and National Aeronautics and Space Administration (NASA) Goddard Space Flight Center to develop a modelling tool to estimate and rank the magnitude of cyanobacterial blooms in lakes using satellite data. The tool was intended to capture the combination of two key aspects of cyanobacterial blooms (amount and duration) that can impact human and wildlife exposure. The model was tested in 135 lakes in Florida and 21 lakes in Ohio, which were previously studied, to build on and compare the model results to past work.
Nine years of European Space Agency (ESA) MEdium Resolution Imaging Spectrometer (MERIS) observations (2003–11) were used to estimate the spatiotemporal mean cyanobacteria biomass (referred to as “bloom magnitude”) using a previously developed index. To compare bloom magnitude across lakes of different size, the seasonal and annual biomass estimates were normalized to lake surface area (referred to as “area-normalized bloom magnitude”). The scientists then ranked the lakes based on the area-normalized bloom magnitude estimates.

This study provides a tool to assess cyanobacterial bloom change over time, even with complicating factors such as variable data acquisition frequency or sensor calibration uncertainties between satellites. Methods developed in this study can be extended to other geographic regions and to satellite observations by the Sentinel-3 Ocean and Land Color Imager (OLCI). In addition, existing World Health Organization (WHO) guidelines or user-defined thresholds can help identify priority areas.
Knowing which lakes have severe or worsening blooms, and which do not, allows resource managers to focus scarce resources on priority areas. The model developed in this study provides a complimentary approach to traditional field collections and laboratory analysis of phytoplankton pigment and cell concentration, biovolume, and biomass.
The authors discuss limitations to the use of satellite data and the model, including the current (2019) satellite sensor resolution that cannot resolve all lakes of interest. In addition, ranking based on lake surface area can result in a high rank for a small lake even though the bloom size is somewhat small, whereas lakes with larger surface areas and a larger absolute value of bloom magnitude, such as Lake Okeechobee in Florida, can rank lower because bloom area as a percentage of water surface area is lower. Finally, remotely sensed data from satellites can be used for detecting and quantifying cyanobacterial biomass, but the algorithms developed for this study currently cannot distinguish between toxic and non-toxic blooms.
Therefore, the authors discuss the use of a combination of techniques, including those developed in this study and more direct field measures. This approach aligns with the Toxins and Harmful Algal Blooms Science Team’s sequential approach for answering fundamental ecological questions about environmental drivers of algal toxin production and release, and the health impacts of algal toxins on humans and wildlife. Each step informs the next in the laboratory and in the field. The results of this study will be particularly useful in designing decision tools to protect health of wildlife and the public from algal toxin exposures.
This study was supported by NASA Ocean Biology and Biogeochemistry Program/Applied Sciences Program proposal 14-SMDUNSOL14-0001, the NOAA, the EPA, and the USGS Toxics Substances Hydrology and Contaminant Biology Programs.
Below are other science projects associated with this project.
Toxins and Harmful Algal Blooms Science Team
Mixtures of Algal Toxins Present Prior to and After Formation of Visible Algal Blooms—Science to Inform the Timing of Algal Toxin Exposure
Understanding Drivers of Cyanotoxin Production in the Lake Okeechobee Waterway
Understanding Associations between Mussel Productivity and Cyanotoxins in Lake Erie
New Method Developed to Quantify Spatial Extent of Cyanobacterial Blooms
Satellite Imagery Used to Measure Algal Bloom Frequency—Steps Toward Understanding Exposure Risk
Cyanobacteria from 2016 Lake Okeechobee Harmful Algal Bloom Photo-Documented
Evaluating Linkages Between Algal Toxins and Human Health
Below are publications associated with this study.
Measurement of cyanobacteria bloom magnitude using satellite remote sensing
Below are news stories associated with this project.
Algal Toxins Detected in One-Third of Streams Assessed in Southeastern United States
Cyanobacterial bloom magnitude during 2003–11 was quantified and ranked in Florida and Ohio lakes with a newly developed modelling tool that allows for the use of multiple satellite data sources and user-defined thresholds. This tool was designed to identify the magnitude of algal blooms, but one metric alone cannot adequately represent the severity of a bloom of interest in terms of toxicity. The combination of this tool with other measures such as bloom frequency, bloom area, and in-lake toxin concentrations, along with advances in satellite data availability, represents an incremental step toward the development of decision tools used to protect health of wildlife and the public from algal toxin exposures.

Cyanobacteria are a perceived global environmental and public health issue, primarily due to their ability to produce toxins. The ability of cyanobacteria to release toxins is well known; however, many fundamental questions remain about the timing and triggers of toxin release. Algal toxins have been associated with adverse human health issues including gastrointestinal distress, dermatitis, or liver failure, and the possible death of pets and livestock that are exposed to water containing toxins. Cyanobacteria within visible algal blooms do not always produce toxins. However, depending on the cyanobacteria present, blooms have the potential to produce toxins and thus bloom presence is often used as an indicator of toxin presence.
To understand the potential health hazards associated with exposure to algal toxins, water managers have expressed the need for tools to determine bloom magnitude for monitoring the status of cyanobacteria in inland lakes and reservoirs. Tools have been previously developed to quantify the biomass of cyanobacteria blooms, but not for quantifying bloom magnitude. Therefore, the U.S. Geological Survey (USGS) Toxins and Harmful Algal Blooms Science Team collaborated with the National Oceanic and Atmospheric Administration (NOAA), U.S. Environmental Protection Agency (EPA), and National Aeronautics and Space Administration (NASA) Goddard Space Flight Center to develop a modelling tool to estimate and rank the magnitude of cyanobacterial blooms in lakes using satellite data. The tool was intended to capture the combination of two key aspects of cyanobacterial blooms (amount and duration) that can impact human and wildlife exposure. The model was tested in 135 lakes in Florida and 21 lakes in Ohio, which were previously studied, to build on and compare the model results to past work.
Nine years of European Space Agency (ESA) MEdium Resolution Imaging Spectrometer (MERIS) observations (2003–11) were used to estimate the spatiotemporal mean cyanobacteria biomass (referred to as “bloom magnitude”) using a previously developed index. To compare bloom magnitude across lakes of different size, the seasonal and annual biomass estimates were normalized to lake surface area (referred to as “area-normalized bloom magnitude”). The scientists then ranked the lakes based on the area-normalized bloom magnitude estimates.

This study provides a tool to assess cyanobacterial bloom change over time, even with complicating factors such as variable data acquisition frequency or sensor calibration uncertainties between satellites. Methods developed in this study can be extended to other geographic regions and to satellite observations by the Sentinel-3 Ocean and Land Color Imager (OLCI). In addition, existing World Health Organization (WHO) guidelines or user-defined thresholds can help identify priority areas.
Knowing which lakes have severe or worsening blooms, and which do not, allows resource managers to focus scarce resources on priority areas. The model developed in this study provides a complimentary approach to traditional field collections and laboratory analysis of phytoplankton pigment and cell concentration, biovolume, and biomass.
The authors discuss limitations to the use of satellite data and the model, including the current (2019) satellite sensor resolution that cannot resolve all lakes of interest. In addition, ranking based on lake surface area can result in a high rank for a small lake even though the bloom size is somewhat small, whereas lakes with larger surface areas and a larger absolute value of bloom magnitude, such as Lake Okeechobee in Florida, can rank lower because bloom area as a percentage of water surface area is lower. Finally, remotely sensed data from satellites can be used for detecting and quantifying cyanobacterial biomass, but the algorithms developed for this study currently cannot distinguish between toxic and non-toxic blooms.
Therefore, the authors discuss the use of a combination of techniques, including those developed in this study and more direct field measures. This approach aligns with the Toxins and Harmful Algal Blooms Science Team’s sequential approach for answering fundamental ecological questions about environmental drivers of algal toxin production and release, and the health impacts of algal toxins on humans and wildlife. Each step informs the next in the laboratory and in the field. The results of this study will be particularly useful in designing decision tools to protect health of wildlife and the public from algal toxin exposures.
This study was supported by NASA Ocean Biology and Biogeochemistry Program/Applied Sciences Program proposal 14-SMDUNSOL14-0001, the NOAA, the EPA, and the USGS Toxics Substances Hydrology and Contaminant Biology Programs.
Below are other science projects associated with this project.
Toxins and Harmful Algal Blooms Science Team
Mixtures of Algal Toxins Present Prior to and After Formation of Visible Algal Blooms—Science to Inform the Timing of Algal Toxin Exposure
Understanding Drivers of Cyanotoxin Production in the Lake Okeechobee Waterway
Understanding Associations between Mussel Productivity and Cyanotoxins in Lake Erie
New Method Developed to Quantify Spatial Extent of Cyanobacterial Blooms
Satellite Imagery Used to Measure Algal Bloom Frequency—Steps Toward Understanding Exposure Risk
Cyanobacteria from 2016 Lake Okeechobee Harmful Algal Bloom Photo-Documented
Evaluating Linkages Between Algal Toxins and Human Health
Below are publications associated with this study.
Measurement of cyanobacteria bloom magnitude using satellite remote sensing
Below are news stories associated with this project.


