
Visitors on the trail, Mt. St. Helens in the background
Images
Explore our planet through photography and imagery, including climate change and water all the way back to the 1800s when the USGS was surveying the country by horse and buggy.
Filter Total Items: 21545

Visitors at Mt. St. Helens
Visitors on the trail, Mt. St. Helens in the background

Yellow Creek near Oak Grove, IN - Winter
Yellow Creek near Oak Grove, IN - Winter
Yellow Creek near Oak Grove, IN - Winter

Winter Streamflow Measurement at South Fork Grand River near Cash, SD
USGS Hydrologic technician Sarah Davis measuring streamflow at the South Fork Grand River near Cash, SD (streamgage 06356500) on January 31, 2019. Measuring the streamflow under ice requires drilling holes across the width of the stream and then collecting data from each hole. At times streams can freeze solid but drilling holes are necessary to verify t
USGS Hydrologic technician Sarah Davis measuring streamflow at the South Fork Grand River near Cash, SD (streamgage 06356500) on January 31, 2019. Measuring the streamflow under ice requires drilling holes across the width of the stream and then collecting data from each hole. At times streams can freeze solid but drilling holes are necessary to verify t

Preparing for fieldwork in Florida Bay
Conducting field work after Hurricane Irma on Bob Allen Key in Florida Bay, Everglades National Park, January 29, 2018. Lynn Wingard (left) and Miriam Jones (right) consult field notes from 2014 to decide where to take samples. Photo: B. Stackhouse, USGS
Conducting field work after Hurricane Irma on Bob Allen Key in Florida Bay, Everglades National Park, January 29, 2018. Lynn Wingard (left) and Miriam Jones (right) consult field notes from 2014 to decide where to take samples. Photo: B. Stackhouse, USGS

Alder root nodules
Root nodules are a symbiotic relationship between a plant and nitrogen-fixing bacteria. A symbiotic relationship is one where both organisms benefit. Nitrogen-fixing bacteria change inorganic nitrogen from the air into ammonia, a form of nitrogen most organisms can use.
Root nodules are a symbiotic relationship between a plant and nitrogen-fixing bacteria. A symbiotic relationship is one where both organisms benefit. Nitrogen-fixing bacteria change inorganic nitrogen from the air into ammonia, a form of nitrogen most organisms can use.

Kīlauea Summit
USGS geologists are conducting field work at the summit today to make observations of volcanic ash and measure volcanic gas. This photograph is taken on Crater Rim Drive where the road intersects the Southwest Rift Zone. Rockfall dust and volcanic ash covers the ground and cracks in line with the Southwest Rift Zone trace traverse the pavement.
USGS geologists are conducting field work at the summit today to make observations of volcanic ash and measure volcanic gas. This photograph is taken on Crater Rim Drive where the road intersects the Southwest Rift Zone. Rockfall dust and volcanic ash covers the ground and cracks in line with the Southwest Rift Zone trace traverse the pavement.

Map of seismicity in the Yellowstone region during 2018
Map of seismicity (white circles) in the Yellowstone region during 2018. Yellow lines are roads, red line shows the caldera boundary, Yellowstone National Park is outlined in black, and dashed lines denote state boundaries.
Map of seismicity (white circles) in the Yellowstone region during 2018. Yellow lines are roads, red line shows the caldera boundary, Yellowstone National Park is outlined in black, and dashed lines denote state boundaries.
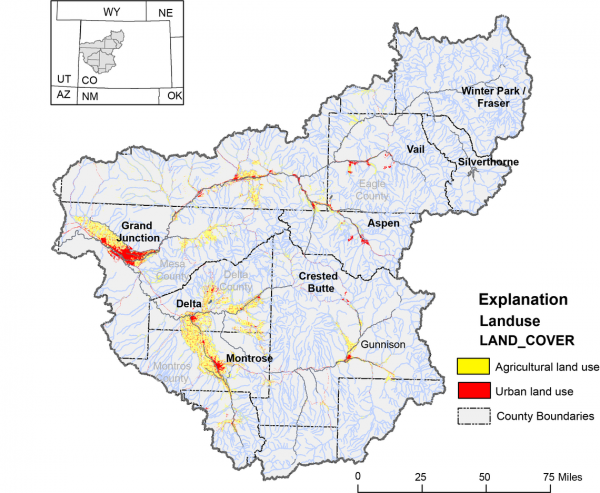
Colorado & Gunnison Basin map
Colorado & Gunnison Basin map
Colorado & Gunnison Basin map

Multi-figure, interactive data visualization of US Water Use
A U.S. national map with notes about areas of high water use in 2015.
A U.S. national map with notes about areas of high water use in 2015.

Three-dimensional model of Chimney Bluffs, New York along Lake Ontari
Three-dimensional model of Chimney Bluffs, New York along Lake Ontario created from low-altitude digital images collected from an unmanned aerial system (UAS).
Three-dimensional model of Chimney Bluffs, New York along Lake Ontario created from low-altitude digital images collected from an unmanned aerial system (UAS).

A brain coral infected with Stony Coral Tissue Loss Disease
A brain coral infected with Stony Coral Tissue Loss Disease (SCTLD) in the Florida Keys National Marine Sanctuary in April 2018.
A brain coral infected with Stony Coral Tissue Loss Disease (SCTLD) in the Florida Keys National Marine Sanctuary in April 2018.

a tiltmeter is ready for installation
On the right, a tiltmeter is ready for installation in a shallow borehole. On the left, the tiltmeter is located at the bottom of a 3 to 4 m (10 to 15 ft) borehole lined with a metal casing. The tiltmeter is surrounded by sand to secure it within the borehole so that it does not touch the casing.
On the right, a tiltmeter is ready for installation in a shallow borehole. On the left, the tiltmeter is located at the bottom of a 3 to 4 m (10 to 15 ft) borehole lined with a metal casing. The tiltmeter is surrounded by sand to secure it within the borehole so that it does not touch the casing.

A windblown stand of hemlock trees at the Wolverine Glacier field site
A windblown stand of hemlock trees at the Wolverine Glacier field site
A windblown stand of hemlock trees at the Wolverine Glacier field site

Aerial view of a southeast Louisiana coastal marsh
Aerial view of a southeast Louisiana coastal marsh.
Aerial view of a southeast Louisiana coastal marsh.

Ambae Island, Ambae eruption sequence, and Ambae evacuations
Ambae Island is in the northern Vanuatu archipelago (Figure A, courtesy of NASA) and hosts a nested caldera at its summit. A temporary seismic-acoustic array was deployed beginning July 2018 (yellow squares). Local airports are marked by the red squares.
Ambae Island is in the northern Vanuatu archipelago (Figure A, courtesy of NASA) and hosts a nested caldera at its summit. A temporary seismic-acoustic array was deployed beginning July 2018 (yellow squares). Local airports are marked by the red squares.

Amy Gartman waits for an X-ray diffractometer
Amy Gartman waits for an X-ray diffractometer to analyze samples of hydrothermal sulfide minerals.
Amy Gartman waits for an X-ray diffractometer to analyze samples of hydrothermal sulfide minerals.

Aquaculture water use in 2015
Aquaculture water use in 2015
Aquaculture water use in 2015

Artesian Well (cropped), John Pennekamp Coral Reef State Park, Key Lar
Artesian Well (cropped), John Pennekamp Coral Reef State Park, Key Largo, FL
Artesian Well (cropped), John Pennekamp Coral Reef State Park, Key Largo, FL

Artesian Well, John Pennekamp Coral Reef State Park, Key Largo, FL
Artesian Well, John Pennekamp Coral Reef State Park, Key Largo, FL
Artesian Well, John Pennekamp Coral Reef State Park, Key Largo, FL

Available Precipitation - Average from 1934 to 2002 In Inches Per Year
Available Precipitation - Average from 1934 to 2002 In Inches Per Year
Available Precipitation - Average from 1934 to 2002 In Inches Per Year

B-Roll: California ShakeAlert Sensor
Maintenance of high quality ShakeAlert sensor, power and telemetry station in the San Francisco Bay Area in California.
Maintenance of high quality ShakeAlert sensor, power and telemetry station in the San Francisco Bay Area in California.