
Threatened giant gartersnake (Thamnophis gigas). This semi-aquatic snake lives in rice fields and the remaining wetlands of California's Central Valley.
Images
Explore our planet through photography and imagery, including climate change and water all the way back to the 1800s when the USGS was surveying the country by horse and buggy.
Filter Total Items: 21545

Threatened Giant Gartersnake (Thamnophis gigas)
Threatened giant gartersnake (Thamnophis gigas). This semi-aquatic snake lives in rice fields and the remaining wetlands of California's Central Valley.

Cable Car
USGS staff member positioned in a cable car, ready to collect streamflow data on Pine Creek near Pinedale, Wyoming.
USGS staff member positioned in a cable car, ready to collect streamflow data on Pine Creek near Pinedale, Wyoming.

Fissure 17 — Marking cracks in roadway
At 10:31 a.m. HST. Cracks on Hwy 132 marked with orange spray paint to track changes through time.
At 10:31 a.m. HST. Cracks on Hwy 132 marked with orange spray paint to track changes through time.

Fissure 17 — slow sticky a'a flow emerges
At 8:00 a.m. HST. A slow sticky a'a flow emerges from a new fissure just over a half mile northeast of the end of Hinalo Street. The new fissure - fissure 17 - is about one half mile south of Hwy 132. Some reports have referred to this fissure as number 18 but that is not correct. Fissure 18 had not erupted by this time.
At 8:00 a.m. HST. A slow sticky a'a flow emerges from a new fissure just over a half mile northeast of the end of Hinalo Street. The new fissure - fissure 17 - is about one half mile south of Hwy 132. Some reports have referred to this fissure as number 18 but that is not correct. Fissure 18 had not erupted by this time.

Fissure 18 - small outbreak
At 2:00 p.m. HST. This photo reveals a small pad of lava between Fissures 16 and 17 which did not appear in photos of the same scene taken this morning. (Red arrow points to the lava pad.) From the photo it appears that this fissure had stagnated. We have designated this small outbreak as Fissure 18.
At 2:00 p.m. HST. This photo reveals a small pad of lava between Fissures 16 and 17 which did not appear in photos of the same scene taken this morning. (Red arrow points to the lava pad.) From the photo it appears that this fissure had stagnated. We have designated this small outbreak as Fissure 18.

Kīlauea LERZ Fissures, May 13 at 9:00 a.m.
Map as of 9:00 a.m. HST, May 13, shows the location of fissure 17, which opened this morning at approximately 4:30 a.m. HST. NOTE: This new fissure was initially referred to as fissure 18 in early reports, but that is incorrect (what was called fissure 17 yesterday did not erupt lava, so this morning's erupting fissure is actually 17).
Map as of 9:00 a.m. HST, May 13, shows the location of fissure 17, which opened this morning at approximately 4:30 a.m. HST. NOTE: This new fissure was initially referred to as fissure 18 in early reports, but that is incorrect (what was called fissure 17 yesterday did not erupt lava, so this morning's erupting fissure is actually 17).
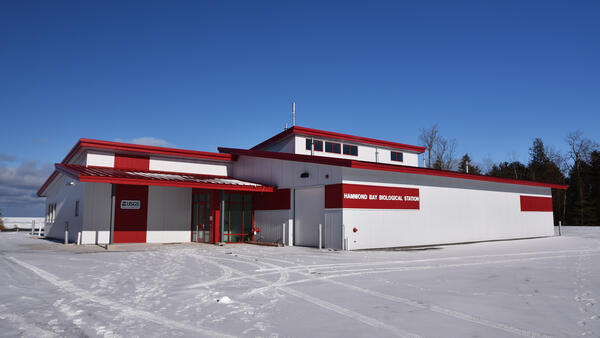
The new Hammond Bay Biological Station laboratory building
The new Hammond Bay Biological Station laboratory building completed in 2019.
The new Hammond Bay Biological Station laboratory building completed in 2019.

5/12/18, 12:57 p.m. HST - Lava was slowly advancing from fissure 16.
5/12/18, 12:57 p.m. HST - Lava was slowly advancing from fissure 16.
5/12/18, 12:57 p.m. HST - Lava was slowly advancing from fissure 16.

An aerial view of fissure 16
5/12/18, 08:27 a.m. HST - An aerial view of fissure 16, located about 1.3 km (0.8 miles) northeast of fissure 15 (top left). The fissure is located 500 m northeast of the Puna Geothermal Venture site (top right). Photograph courtesy of Hawai`i County Fire Department.
5/12/18, 08:27 a.m. HST - An aerial view of fissure 16, located about 1.3 km (0.8 miles) northeast of fissure 15 (top left). The fissure is located 500 m northeast of the Puna Geothermal Venture site (top right). Photograph courtesy of Hawai`i County Fire Department.

Kīlauea LERZ Fissures, May 12 at 12:00 p.m.
Main map shows the location of fissure 16, as well as earlier fissures, lava flows, and steaming areas, as of 12:00 p.m. HST, May 12. Inset map shows fissures in Leilani Estates in the order they occurred since May 3. Shaded purple areas indicate lava flows erupted in 1840, 1955, 1960, and 2014-2015.
Main map shows the location of fissure 16, as well as earlier fissures, lava flows, and steaming areas, as of 12:00 p.m. HST, May 12. Inset map shows fissures in Leilani Estates in the order they occurred since May 3. Shaded purple areas indicate lava flows erupted in 1840, 1955, 1960, and 2014-2015.

High water mark sign at Yellowstone River at Carters Bridge
High water mark sign at Yellowstone River at Carters Bridge
High water mark sign at Yellowstone River at Carters Bridge

It's an extraordinary time on Kīlauea!
To help us understand what could happen at Kīlauea Volcano's summit, we look to past similar events, but this does not mean that future events will be exactly the same. This map shows the distribution of ballistics and tephra from the 1924 phreatic (steam-driven) explosions.
To help us understand what could happen at Kīlauea Volcano's summit, we look to past similar events, but this does not mean that future events will be exactly the same. This map shows the distribution of ballistics and tephra from the 1924 phreatic (steam-driven) explosions.

It's an extraordinary time on Kīlauea!
On the morning of May 9, 2018, a large rockfall in "Overlook crater" within Halema‘uma‘u at the summit of Kīlauea triggered a gas-driven explosion that sent an ash plume several thousand feet skyward. Phreatic (steam-driven) explosions can create larger ash plumes; the 1924 explosions sent ash plumes up to 20,000 feet high. USGS photo.
On the morning of May 9, 2018, a large rockfall in "Overlook crater" within Halema‘uma‘u at the summit of Kīlauea triggered a gas-driven explosion that sent an ash plume several thousand feet skyward. Phreatic (steam-driven) explosions can create larger ash plumes; the 1924 explosions sent ash plumes up to 20,000 feet high. USGS photo.

Highway 130 newly cracked with steam coming up on May 10, 2018
On May 10, 2018, Highway 130 (shown here) was newly cracked with steam coming up from the east side of the road due to the dike (tabular body of magma) that intruded Kīlauea's lower East Rift Zone. The two orange and white road markers are on slightly uplifted areas of the highway, which are about 100 m (330 ft) apart.
On May 10, 2018, Highway 130 (shown here) was newly cracked with steam coming up from the east side of the road due to the dike (tabular body of magma) that intruded Kīlauea's lower East Rift Zone. The two orange and white road markers are on slightly uplifted areas of the highway, which are about 100 m (330 ft) apart.

R/V Sallenger and seismic sled used for sub-bottom surveying
A team of USGS scientists work off the R/V Sallenger in Rockaway Beach, New York. One team member stands on a floating sled that enables sub‐bottom surveying in shallow water, nearshore, and shore‐face environments. The sled is equipped with an EdgeTech SB‐512i CHIRP system and single‐beam sonar.
A team of USGS scientists work off the R/V Sallenger in Rockaway Beach, New York. One team member stands on a floating sled that enables sub‐bottom surveying in shallow water, nearshore, and shore‐face environments. The sled is equipped with an EdgeTech SB‐512i CHIRP system and single‐beam sonar.

USGS scientists measure beach elevation and other profiles
USGS scientists measure beach elevation and other profile characteristics as part of a project that models how barrier islands will likely change with sea-level rise - and how those changes will ultimately affect piping plover and other shorebird nesting habitat availability.
USGS scientists measure beach elevation and other profile characteristics as part of a project that models how barrier islands will likely change with sea-level rise - and how those changes will ultimately affect piping plover and other shorebird nesting habitat availability.

A researcher holds a cinnamon teal duck wearing a GPS tracker
A researcher holds a cinnamon teal duck wearing a GPS tracker
A researcher holds a cinnamon teal duck wearing a GPS tracker

Collecting Cores at Lake Drummond, Great Dismal Swamp
Scientists collect cores on Lake Drummond, located within the Great Dismal Swamp.
Scientists collect cores on Lake Drummond, located within the Great Dismal Swamp.

Coring on Lake Drummond
Michael Toomey, Jessica Rodysill, and Tom Sheehan collect sediment cores from Lake Drummond, located within the Great Dismal Swamp. The cores were obtained using a vibracore, which was mounted on a platform between two canoes.
Michael Toomey, Jessica Rodysill, and Tom Sheehan collect sediment cores from Lake Drummond, located within the Great Dismal Swamp. The cores were obtained using a vibracore, which was mounted on a platform between two canoes.

Elkhorn coral on a USGS calcification assessment station, Dry Tortugas
Established in 2009, the U.S. Geological Survey’s Coral Assessment Network (USGS-CAN) provides data on coral-growth (calcification) rates throughout the Florida Keys. Pictured here is one of 30 stations located in in Dry Tortugas National Park.
Established in 2009, the U.S. Geological Survey’s Coral Assessment Network (USGS-CAN) provides data on coral-growth (calcification) rates throughout the Florida Keys. Pictured here is one of 30 stations located in in Dry Tortugas National Park.

gas-driven explosion
On the morning of May 9, 2018, a large rockfall in "Overlook crater" within Halema‘uma‘u at the summit of Kīlauea triggered a gas-driven explosion that sent an ash plume several thousand feet skyward. Phreatic (steam-driven) explosions can create larger ash plumes; the 1924 explosions sent ash plumes up to 20,000 feet high.
On the morning of May 9, 2018, a large rockfall in "Overlook crater" within Halema‘uma‘u at the summit of Kīlauea triggered a gas-driven explosion that sent an ash plume several thousand feet skyward. Phreatic (steam-driven) explosions can create larger ash plumes; the 1924 explosions sent ash plumes up to 20,000 feet high.