
A view of the R/V Alaskan Gyre with a glacier in the background in Harriman Fjord in Prince William Sound, Alaska
Images
Explore our planet through photography and imagery, including climate change and water all the way back to the 1800s when the USGS was surveying the country by horse and buggy.
Filter Total Items: 21545

The R/V Alaskan Gyre in Harriman Fjord, Prince William Sound, Alaska
A view of the R/V Alaskan Gyre with a glacier in the background in Harriman Fjord in Prince William Sound, Alaska

Time-averaged image from video of beach in Duck, North Carolina
Time-averaged image, or “timex,” created by averaging the intensity of light recorded at each spot, or “pixel,” during a video taken at Duck, North Carolina, on September 1, 2015. Blurred white zones show where waves are breaking. Light band paralleling the shore marks an offshore sandbar. Dark bands extending away from the beach indicate rip channels.
Time-averaged image, or “timex,” created by averaging the intensity of light recorded at each spot, or “pixel,” during a video taken at Duck, North Carolina, on September 1, 2015. Blurred white zones show where waves are breaking. Light band paralleling the shore marks an offshore sandbar. Dark bands extending away from the beach indicate rip channels.

USGS Documents 2015 Western U.S. Drought
A hydrologic technician from the USGS Idaho Water Science Center measures streamflow in the St. Joe River at Red Ives Ranger Station in northern Idaho. The USGS is collecting data at hundreds of sites on rivers and streams in six western states to document the 2015 drought.
A hydrologic technician from the USGS Idaho Water Science Center measures streamflow in the St. Joe River at Red Ives Ranger Station in northern Idaho. The USGS is collecting data at hundreds of sites on rivers and streams in six western states to document the 2015 drought.

Milford Lake Water Sampling
USGS employees gathering water samples on a boat in the middle of Milford Lake in Kansas.
USGS employees gathering water samples on a boat in the middle of Milford Lake in Kansas.

Divers prepare oceanographic equipment
Divers prepare patterns of known targets for verification of sonar resolution.
Divers prepare patterns of known targets for verification of sonar resolution.

Sagebrush around Granby and Willow Creek Reservoirs
Sagebrush around Granby and Willow Creek Reservoirs.
Sagebrush around Granby and Willow Creek Reservoirs.

Sagebrush, grasses, and forbs in a shrub-steppe ecosystem
Determining aboveground biomass of sagebrush, grasses, and forbs is important for estimating fuel loads, measuring carbon storage, and assessing habitat quality in shrublands. Remote sensing may offer a more efficient alternative to common, labor intensive methods of measuring aboveground biomass that are difficult to apply across large areas.
Determining aboveground biomass of sagebrush, grasses, and forbs is important for estimating fuel loads, measuring carbon storage, and assessing habitat quality in shrublands. Remote sensing may offer a more efficient alternative to common, labor intensive methods of measuring aboveground biomass that are difficult to apply across large areas.

Vegetation monitoring in the area burned by the Soda Fire, 2015
USGS scientists monitor BLM efforts to restore vegetation in the area burned byt he 2015 Soda Fire in southwest Idaho and southeast Oregon sagebrush-steppe.
USGS scientists monitor BLM efforts to restore vegetation in the area burned byt he 2015 Soda Fire in southwest Idaho and southeast Oregon sagebrush-steppe.
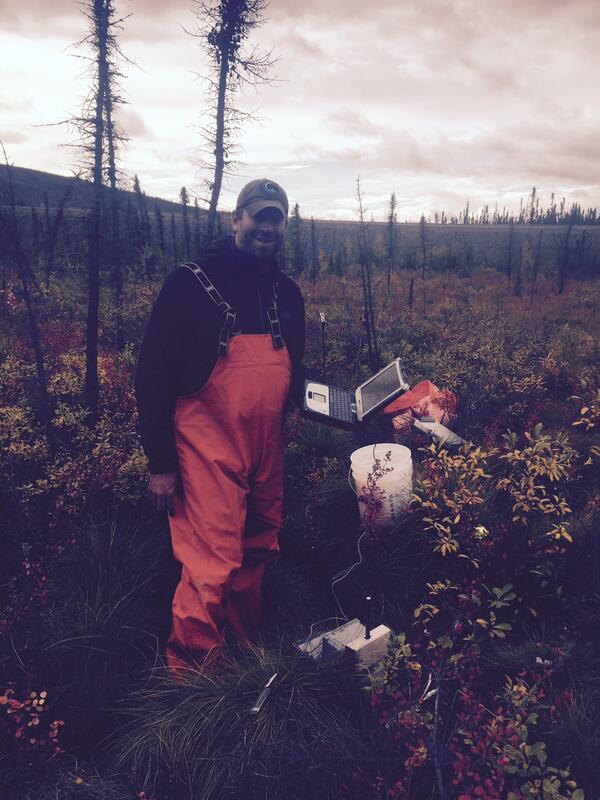
Ryan Toohey at the Active Layer Network grid, Alaska.
Ryan Toohey at the Active Layer Network grid near Hess Creek, Alaska.
Ryan Toohey at the Active Layer Network grid near Hess Creek, Alaska.

USGS Documents 2015 Western U.S. Drought
A hydrologic technician from the USGS Idaho Water Science Center measures streamflow in Lightning Creek at Clark Fork, ID. The USGS is collecting data at hundreds of sites on rivers and streams in six western states to document the 2015 drought. USGS scientists will analyze the data to identify which rivers and streams may be most vulnerable to future droughts.
A hydrologic technician from the USGS Idaho Water Science Center measures streamflow in Lightning Creek at Clark Fork, ID. The USGS is collecting data at hundreds of sites on rivers and streams in six western states to document the 2015 drought. USGS scientists will analyze the data to identify which rivers and streams may be most vulnerable to future droughts.

Gloeotrichia echinulata Under Epifluorescent Microscope
This organism forms a colony that is the size of a pin head and can be seen floating in the water. Using ultra violet light, the filaments glow red from chlorophyll, while other pigments give various hues of purple, which may be a hint about the health of the cells.
This organism forms a colony that is the size of a pin head and can be seen floating in the water. Using ultra violet light, the filaments glow red from chlorophyll, while other pigments give various hues of purple, which may be a hint about the health of the cells.

Gloeotrichia echinulata Under Epifluorescent Microscope
This organism forms a colony that is the size of a pin head and can be seen floating in the water. The filaments glow red from chlorophyll, the yellow-green mass in the center is the mucilage that binds the filaments into the colony and green spots are associated bacteria, illuminated with the DNA stain Sytox Green ®.
This organism forms a colony that is the size of a pin head and can be seen floating in the water. The filaments glow red from chlorophyll, the yellow-green mass in the center is the mucilage that binds the filaments into the colony and green spots are associated bacteria, illuminated with the DNA stain Sytox Green ®.

Gloeotrichia echinulata Under Epifluorescent Microscope
This organism forms a colony that is the size of a pin head and can be seen floating in the water. Using ultra violet light, the filaments glow red from chlorophyll, while other pigments give various hues of purple, which may be a hint about the health of the cells.
This organism forms a colony that is the size of a pin head and can be seen floating in the water. Using ultra violet light, the filaments glow red from chlorophyll, while other pigments give various hues of purple, which may be a hint about the health of the cells.

Sediment-laden White River 11 km downstream of the OR35 bridge. Hea...
Sediment-laden White River 11 km downstream of the OR35 bridge. Heavy rains resulted in high-sediment loads within this river, which drains Mount Hood, Oregon.
Sediment-laden White River 11 km downstream of the OR35 bridge. Heavy rains resulted in high-sediment loads within this river, which drains Mount Hood, Oregon.

View of White River from the OR35 bridge after the Aug. debris flows
View from the OR35 bridge over the White River looking downstream. Glistening areas are deposits from recent debris flows.
View from the OR35 bridge over the White River looking downstream. Glistening areas are deposits from recent debris flows.

School Branch at CR750N at Brownsburg IN
School Branch at CR750N at Brownsburg IN
School Branch at CR750N at Brownsburg IN

USGS Documents 2015 Western U.S. Drought
A hydrologic technician from the USGS Idaho Water Science Center measures streamflow in Homer Creek near Herman, ID. The USGS is collecting data at hundreds of sites on rivers and streams in six western states to document the 2015 drought. USGS scientists will analyze the data to identify which rivers and streams may be most vulnerable to future droughts.
A hydrologic technician from the USGS Idaho Water Science Center measures streamflow in Homer Creek near Herman, ID. The USGS is collecting data at hundreds of sites on rivers and streams in six western states to document the 2015 drought. USGS scientists will analyze the data to identify which rivers and streams may be most vulnerable to future droughts.

Herring River Estuary, Cape Cod, MA
Tidally restricted wetland in the Herring River Estuary, Cape Cod, MA
Tidally restricted wetland in the Herring River Estuary, Cape Cod, MA

Sensor housing mid-bay-deployment screw-anchor Long Island, NY
Sensor housing mid-bay-deployment screw-anchor
Sensor housing mid-bay-deployment screw-anchor

Collecting data on coastal wetland on Long Island, NY
Collecting data on coastal wetland on Long Island, NY
Collecting data on coastal wetland on Long Island, NY