
This image shows Hurricane Ian making its first U.S. landfall in southwest Florida near Cayo Costa September 28, 2022, bringing with it extreme storm surge, category 4 winds and a deluge of rain. Ian made a second U.S. landfall September 30, 2022, in Georgetown, South Carolina. Photos by NOAA.
Multimedia
USGS maintains an array of multimedia resources related to hurricanes. This collection includes videos, photography, and audio. You can listen to webinars, watch live action from the field and stunning images selected as “Image of the Week.” All items are considered public domain unless otherwise noted.
Images

Hurricane Ian approaching Florida
This image shows Hurricane Ian making its first U.S. landfall in southwest Florida near Cayo Costa September 28, 2022, bringing with it extreme storm surge, category 4 winds and a deluge of rain. Ian made a second U.S. landfall September 30, 2022, in Georgetown, South Carolina. Photos by NOAA.

Hurricane Maria Impacting the Eastern Caribbean
Colorized satellite imagery from 2017-09-19 15:00 UTC of Hurricane Maria impacting the Eastern Caribbean. Data provided by NOAA. Base image is intellectual property of NOAA and is used herein under license. Copyright Esri and its creator.
Colorized satellite imagery from 2017-09-19 15:00 UTC of Hurricane Maria impacting the Eastern Caribbean. Data provided by NOAA. Base image is intellectual property of NOAA and is used herein under license. Copyright Esri and its creator.

Hurricane Tracks, Puerto Rico
Hurricane tracks for Hugo (1989), Georges (1998), Irma (2017) and Maria (2017). Data provided by NOAA. Base image is intellectual property of Esri and is used herein under license. Copyright Esri and its creator.
Hurricane tracks for Hugo (1989), Georges (1998), Irma (2017) and Maria (2017). Data provided by NOAA. Base image is intellectual property of Esri and is used herein under license. Copyright Esri and its creator.

Pre and Post Hurricane Dorian Aerial Imagery
Pre- and post-Hurricane Dorian aerial imagery showing extreme sediment transport, overwash and breaches along the barrier islands of the North Carolina coast.
Pre- and post-Hurricane Dorian aerial imagery showing extreme sediment transport, overwash and breaches along the barrier islands of the North Carolina coast.

Hurricane Dorian water level changes.
Land surface elevation and modeled water level changes at Pamlico Sound during Hurricane Dorian. Small red box shows where the breaches to barrier islands were modeled.
Land surface elevation and modeled water level changes at Pamlico Sound during Hurricane Dorian. Small red box shows where the breaches to barrier islands were modeled.
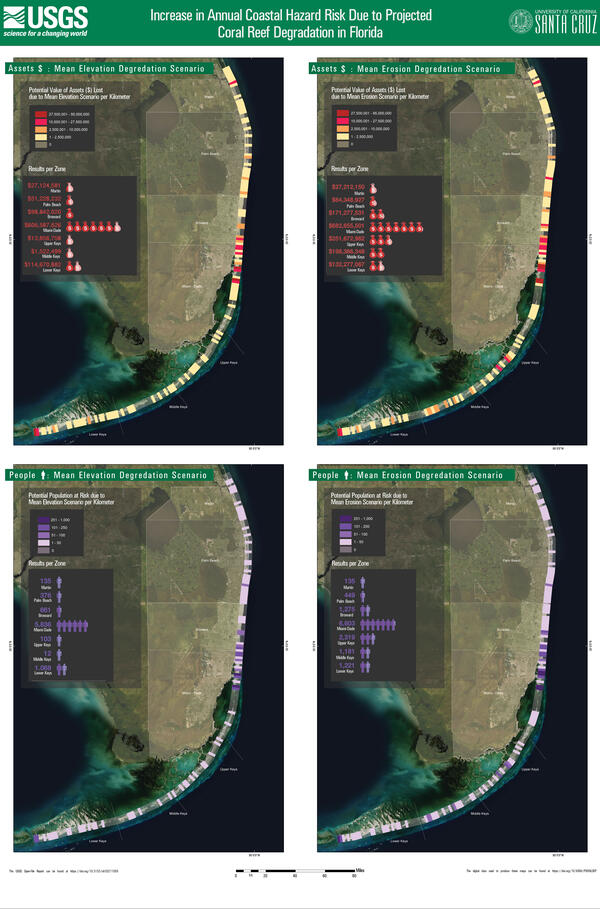
Coastal hazard risk increase due to reef degradation: Florida
Four scenarios for the southern part of the Florida coastline show the increase in annual coastal hazard risk due to projected coral reef degradation.
Four scenarios for the southern part of the Florida coastline show the increase in annual coastal hazard risk due to projected coral reef degradation.
Videos

USGS hydrologists respond to historic hurricane season
Throughout the historically active 2020 Atlantic Hurricane Season,USGS hydrologists have been working quickly to collect vital flood and streamflow information in impacted areas.
Throughout the historically active 2020 Atlantic Hurricane Season,USGS hydrologists have been working quickly to collect vital flood and streamflow information in impacted areas.

Sea-Level Rise, El Niño, and Storm Effects on Coastal Tidal Marshes
Tidal marshes exist as a transitional environment between the land and sea, and provides habitat to fish and wildlife, protects human developments from coastal flooding, and stores carbon at high density, among other important ecosystem services.
Tidal marshes exist as a transitional environment between the land and sea, and provides habitat to fish and wildlife, protects human developments from coastal flooding, and stores carbon at high density, among other important ecosystem services.

USGS Storm Tide Sensors: Measuring Coastal Storm Tide and Flooding
USGS Storm Tide Sensors are specialized scientific instruments used to measure the depth and duration of storm surge during coastal storms. The data these sensors collect before, during and after a storm will help public officials assess storm damage, and improve computer models used to forecast storm surge and coastal change.
USGS Storm Tide Sensors are specialized scientific instruments used to measure the depth and duration of storm surge during coastal storms. The data these sensors collect before, during and after a storm will help public officials assess storm damage, and improve computer models used to forecast storm surge and coastal change.

Image of the Week - Hurricane Michael
Hurricane Michael made landfall in the Florida Panhandle on October 10, 2018.
Landsat 7 images captured before and after highlight the destructive path of the Category 4 storm.
Hurricane Michael made landfall in the Florida Panhandle on October 10, 2018.
Landsat 7 images captured before and after highlight the destructive path of the Category 4 storm.

Image of the Week - Hurricane Florence
Hurricane Florence hit the Carolina coast on September 14, 2018, but it took much longer for the full impact to emerge.
Remotely-sensed images show the slow devastation that 13 trillion gallons of rain can bring as it moves back toward the sea.
Hurricane Florence hit the Carolina coast on September 14, 2018, but it took much longer for the full impact to emerge.
Remotely-sensed images show the slow devastation that 13 trillion gallons of rain can bring as it moves back toward the sea.

There’s a Hurricane A-comin’: A View from Space
The 2017 Atlantic Hurricane season has seen several hurricanes in a row during the months of August, September, and October. Follow along with this video to see satellite imagery of hurricanes and tropical storms during this time period.
The 2017 Atlantic Hurricane season has seen several hurricanes in a row during the months of August, September, and October. Follow along with this video to see satellite imagery of hurricanes and tropical storms during this time period.