
Science
Historic low water levels at saline lakes and across the Great Basin are posing challenges for the birds and other wildlife that depend on these habitats. The Saline Lakes Team is developing a regional strategic science plan that will be used to guide data collection, scientific research, and assessment activities on the status of water, habitat, and birds in and across 20 saline lakes.
FAQs

How is the salinity of Great Salt Lake measured?
The salinity of Great Salt Lake is measured by taking specific gravity and temperature measurements and comparing them to standardized values reported in a table. Specific gravity is measured in the field by testing a water sample with a device very similar to a battery or antifreeze tester. Learn more: Great Salt Lake, Utah
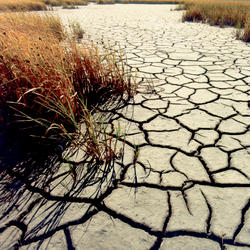
What causes drought?
A drought is a period of drier-than-normal conditions that results in water-related problems. The amount of precipitation at a particular location varies from year to year, but over a period of years the average amount is fairly constant. In the deserts of the Southwest, the average precipitation is less than 3 inches per year. In contrast, the average precipitation in the Northwest is more than...

Where in the Nation are droughts or very low flows occurring now? How can I see these sites on a map and get to the data?
To view the USGS streamflow information on drought, see the drought map on our WaterWatch site, which shows below-normal, 7-day average streamflow compared to historical streamflow for the United States. Links to additional maps and drought data are listed on the USGS Drought website and the National Integrated Drought Information System (NIDIS) .