How Big and How Frequent Are Earthquakes on the Wasatch Fault?
Release Date: FEBRUARY 1, 2015
Paleoseismology along the Wasatch Fault in Utah is helping to estimate the shaking risk to nearby towns.
Where is the Wasatch Fault?
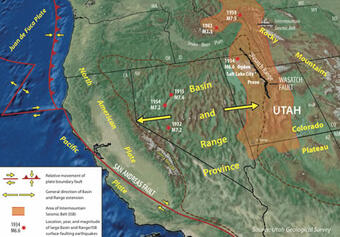
The Wasatch Fault parallels the western base of the Wasatch Range for approximately 350 km (220 miles), from near Fayette, Utah in the south to near Malad City, Idaho in the north. The Wasatch Fault is also known as the Wasatch fault zone (WFZ) since it isn't a single long fault, but rather a series of fault segments. It's no coincidence that the fault parallels the mountains; the mountains were created during the last several million years by many earthquakes along the fault zone.
The Wasatch fault zone quakes occur on normal faults that dip at an angle under the valley to the west. Repeated fault movements during earthquakes have formed the mountains to the east and the valleys to the west.
The WFZ marks the boundary between the Basin and Range Province to the west, an area being slowly pulled apart in an east-west direction, and the Middle Rocky Mountains and Colorado Plateau regions to the east, more stable areas thought to have fewer active faults.
What do we already know?
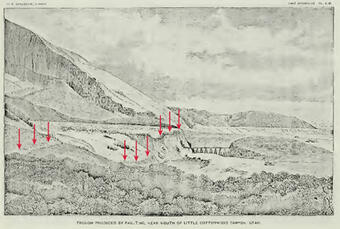
For over a century, geologists have documented tectonic fault scarps along the Wasatch fault zone. In the 1880s, renowned geologist G.K. Gilbert first reported fault scarps at the mouth of Little Cottonwood Canyon, approximately 20 km (12 miles) south of downtown Salt Lake City, and suggested the scarps were evidence of prehistoric ground-rupturing earthquakes. Today there is a park at this locationcommemorating Gilbert's work and showcasing the geological features.
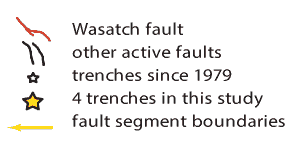
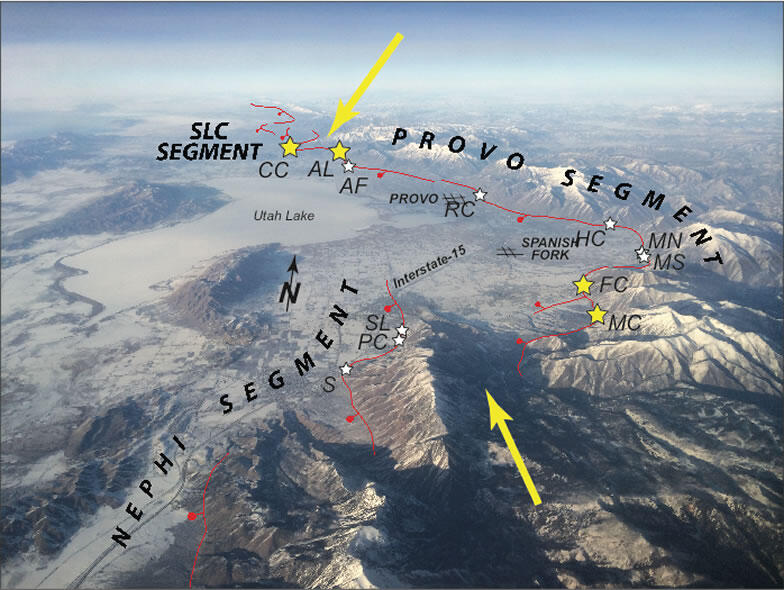
Since 1979, paleoseismologists, scientists who study past earthquakes, have excavated numerous paleoseismic trenches along the WFZ (white stars on the location map, at right), with the goal of documenting the timing and frequency of past earthquakes (see Paleoseismology of Utah Series, Utah Geological Survey). Paleoseismologists used this information about the recent past to provide insight into the frequency of future earthquakes and ground shaking, for example, as with the 2014 USGS National Seismic Hazard Maps. In connection with the trenching work, geologists produced detailed maps of the Wasatch fault trace and the rock units and young alluvial deposits that it cuts.
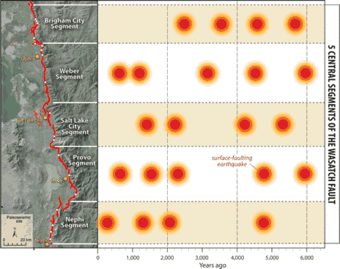
Together, these contributions led to the subdivision of the WFZ into 10 structural fault segments, each approximately 30-60 km (19-37 miles) long. The central five fault segments have been active during Holocene time (the last 10,000 years) and produce large (magnitude 7.0) earthquakes about every 900-1300 years. The most recent earthquake on fault segments near Weber, Provo, and Nephi occurred 200-700 years ago. The most recent earthquake on the Salt Lake City segment occurred 1200-1600 years ago. It has been 2200-2800 years since the most recent earthquake on the Brigham City fault segment.
What is still unknown?
Paleoseismologic studies have provided a detailed record of Holocene earthquakes on the WFZ. This record generally suggests that individual magnitude 7.0 earthquake ruptures have been limited to one of the approximately 30-60 km-long fault segments. However, in a few cases, the data could also be interpreted as multi-segment ruptures on the WFZ, where rupture spanned a segment boundary.
Multi-segment earthquake ruptures on the WFZ may have produced longer surface ruptures and generated larger (magnitude 7.4) earthquakes; however, they may also result in less frequent and fewer total surface-rupturing earthquakes. The extent and frequency of ruptures that span segment boundaries remain poorly known, adding uncertainty to seismic hazard models for this populated region of Utah.

What are we doing?
A team of scientists from the USGS Geological Hazards Science Center, led by Mendenhall Postdoctoral Fellow Scott Bennett and Research Geologists Ryan Gold, Richard Briggs, Christopher DuRoss, and Stephen Personius are collaborating with scientists at the Utah Geological Survey to gather data from new paleoseismic trenches along the Wasatch fault zone. These new datasets will help researchers to understand if past surface-rupturing earthquakes have spanned fault segment boundaries. They are also analyzing new high-resolution airborne LiDAR topographic data to characterize previously unmapped fault traces and to measure how vertical displacements (vertical offset of the ground surface from faulting) vary, both in space (from north to south) and time (the last 20,000 years).
Down in the Trenches - Paleoseismology
The USGS and collaborators are excavating trenches near the Salt Lake City-Provo and Provo-Nephi fault segment boundaries (yellow arrows on the map below). These trenches near fault segment boundaries can provide critical information about the length and displacement of past earthquakes. These data will also allow the researchers to figure out if past earthquakes repeatedly stop at a fault segment boundary or sometimes break through.
Preliminary observations include evidence for four to seven Holocene earthquakes at each trenching site. Ongoing geochronologic analysis will help determine the timing of these earthquakes. The timing of these earthquakes will be compared to earthquakes observed in trenches on adjacent fault segments to help identify through-going ruptures across segment boundaries.
Up in the Air - Lidar Analysis
Lidar, which stands for Light Detection And Ranging, is a remote sensing method that uses laser pulses, usually from a specially-equipped airplane, to create detailed topographic maps of Earth's surface. Lidar is able to "see through" the vegetation to record ground elevations and is a much faster and more precise way to gather topographical data than collecting data with a ground survey.
The USGS, in collaboration with the Utah Geological Survey, Federal Emergency Management Agency (FEMA), Utah Division of Emergency Management, Salt Lake County Surveyor's office and partner cities, has acquired 3,683 sq. km (approx. 1,400 sq. miles) of new high-resolution (8 points per sq. meter) airborne lidar topographic data along the entire WFZ. These data are available to the public. Detailed bare-earth digital elevation models (DEMs) and hillshade models of these LiDAR data allow the scientists to identify previously unmapped fault traces, providing a more complete story of Holocene earthquake ruptures on the WFZ.
Analysis of the lidar data helps quantify fault displacements and slip rates, allows scientists to estimate the extent of fault ruptures associated with most recent earthquakes, and documents spatial and temporal slip patterns near fault segment boundaries.
Preliminary observations identify numerous previously undocumented fault scarps, including recent scarps north of Ogden, UT that may correspond with a late Holocene rupture that spanned the Brigham City-Weber fault segment boundary, as previously suggested from nearby paleoseismic trench studies.
In the Trenches on a Paleoseismology Project
What's really involved in planning and completing a paleoseismology project like this one on the Wasatch fault zone? It's more time-consuming and interesting than you might think.
Selecting and Preparing the Site
The first order of business is selecting a trench site. The trench site location depends on the scientific questions to be answered and the ability to gain permission to dig a trench at the site. In this Wasatch fault zone study, the scientists needed to select site locations that were near the end of known fault segments, so a good bit of staring at maps and wandering around in the field preceded site selection. After a few potential sites are identified, scientists need to get permission from the landowner to dig a paleoseismic trench across the fault; the land may be private property, or owned by the Local, State, or Federal government. Once permission is granted, a detailed topographic survey is completed to record the natural site conditions before any trenching is started.
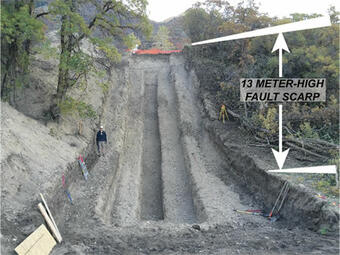
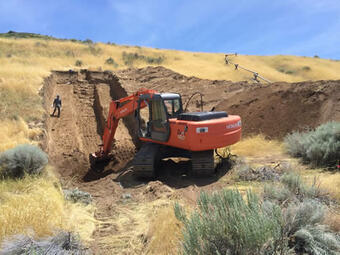
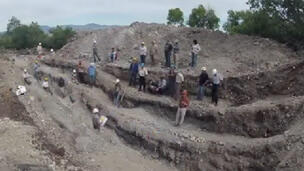
Now it's time to bring in the excavator and dig the trench. A typical paleoseismology study onthe Wasatch fault zone requires a single trench about 40-50 meters (130-160 feet) long, 5 meters (16 feet) side, and up to 5 meters (16 feet) deep. A trench usually takes one day to excavate, although this time can vary depending on the size of the trench or if more than one trench is excavated.
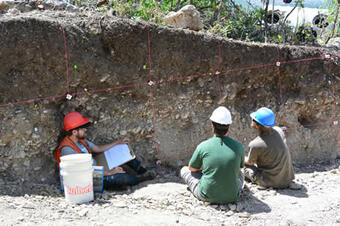
As soon as the excavator does its job, the paleoseismologists get to work cleaning the walls of the trench, much like archeologists cleaning an archaeological site. They want to make the trench walls as "clean" as possible and to prepare a fresh geologic exposure of the sediment layers and the faults that cut and offset these layers. Preserved in the trench walls is the geologic and tectonic record of paleo-earthquakes at this location along the Wasatch fault zone.
The trench is ready now for the scientists to set up a coordinate system on the vertical walls of the trench so that all the information can be precisely recorded. String and nails are used to create a grid on the trench walls. These horizontal and vertical grid lines are spaced exactly 1 meter apart, like a graph-paper overlay. Next, detailed photos are taken of the entire extent of the trench walls and are pieced together to create a photo mosaic of the trench. In the past this task was done manually and took several dozen person-hours. Recently, new software automatically creates a photo mosaic with more accuracy and requires fewer person hours. The software also creates a 3-dimensional model of the trench that can be rotated and manipulated to reproduce a virtual trench that can be studied long after the real trench has been filled in. Once the trench grid is set and the trench photo mosaics are printed, paleoseismologists can begin logging the trench.
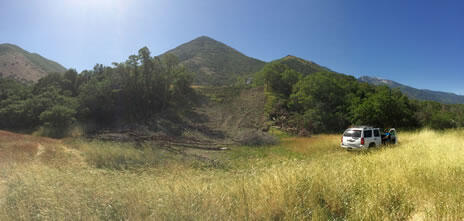
Interactive 3-D Model of Alpine Trench
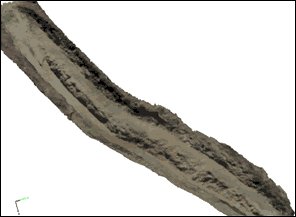
Download and interact with 3-D model of the Alpine trench.
(6.3MB PDF, Adobe Reader required).
Photos by Kendra Johnson and Ed Nissen (Colorado School of Mines). Model created by Nadine Reitman. (If PDF opens a blank page in your browser, right/control-click on it and download it to your desktop.)
Time-Lapse Video of the Flat Canyon Trench Excavation
Down in the Trenches & Up in the Air - Collecting Data
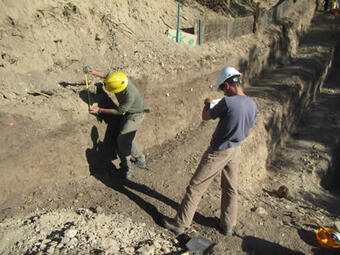
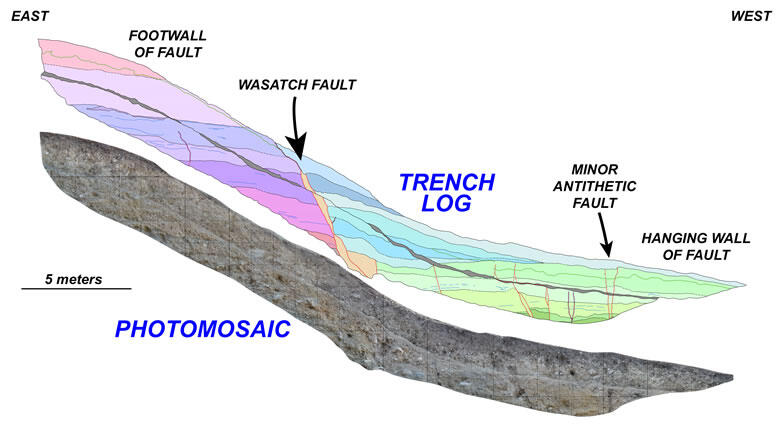
The trench log is a map of the trench wall drawn on a small-scale paper print out of the trench photo mosaic. Paleoseismologists record details of the trench walls onto the trench logs. These details include the location and type of geologic contacts between layers of sediment (a.k.a. geologic units), the location and orientation of faults that cut these sediments, and any other evidence for ground shaking and failure during or after a large paleo-earthquake.
Careful descriptions of color, grain size, moisture, and density are recorded for each geologic unit. Samples of important geologic units are collected and sent to a laboratory to be age-dated. The geologic age of a sample is determined by various age-dating techniques, such as carbon-14 dating and luminescence dating.
The deformation of sediment, faults, and other features in the trench walls tell the sequential story of past earthquakes at that location, and age-dating informs paleoseismologists when the past earthquakes happened. Collecting all the data to reconstruct the story takes a team of scientists about two weeks in the trench, carefully recording everything onto the trench log. When the job is done they celebrate with a "trench party", where interested scientists and local citizens are invited to tour the trench and discuss the geologic interpretations before it is filled in.
As part of this Wasatch fault zone project, an airborne LiDAR topographic survey was conducted of the entire Wasatch fault zone. The LiDAR survey along the length of the fault took approximately 8 weeks of flying time between the Fall of 2013 and Spring of 2014.
LiDAR data provides a very high-resolution picture of Earth's surface so subtle features (like fault scarps) that may be missed during ground mapping can be identified from a bird's eye view. The laser scanner that does all the work is slightly larger than a large coffee can and is mounted to the underside of a small plane that flies back and forth over an area until the entire fault zone has been surveyed.
The laser pulses are able to penetrate vegetation and bounce off Earth's surface, so even if an area is covered with a dense forest, LiDAR is able to measure the surface elevation beneath the tree canopy.
Back at the Computer - Processing & Analyzing the Data
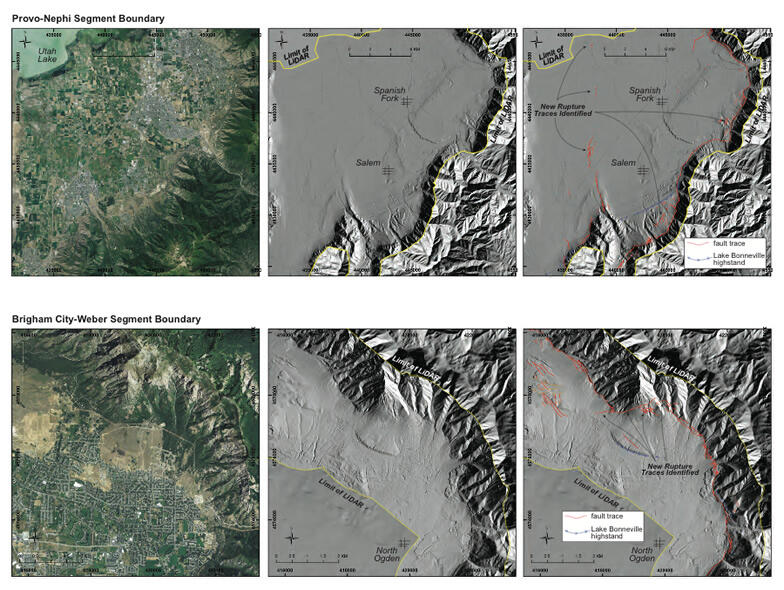
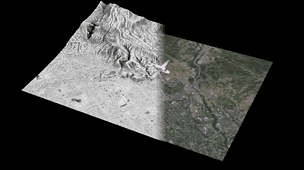
The point data collected from the LiDAR survey are processed to create a digital elevation model (DEM), a digital representation of the ground surface, similar to a topographic map. Shining a "digital light" onto the DEM, which simulates the early morning or late afternoon sun, creates a digital hillshade model that includes "fake shadows," which can reveal subtle topographic features such as fault scarps. USGS scientists use these hillshade models to identify several new fault traces that had never been noticed before.
The trench logs are also turned into a digital picture to illustrate the geologic relationships and to measure fault offset of geologic layers. Once the age-dating laboratory determines the ages of the geologic samples from the trench, that data is used to figure out when paleo-earthquakes occurred at that location.
In this Wasatch fault zone study, scientists are looking for paleo-earthquakes near the end of one fault segment that happened at the same time as paleo-earthquakes on the adjacent fault segment, indicating that the earthquake occurred on both fault segments. Such information would support that the paleo-earthquake could have been larger (and probably less frequent) than if it had happened only on a single fault segment.
-written by Lisa Wald, U.S. Geological Survey
For More Information
- Paleoseismology of the Hayward Fault
- New Information from Paleoseismology of the San Andreas Fault
- Utah Geological Survey
- The Wasatch Fault, Utah Geological Survey Public Information Series 40, 1996
- Paleoseismology of Utah Series, Utah Geological Survey
- Putting Down Roots in Earthquake Country
The Scientists Behind the Science
- Scott Bennett
- Richard Briggs
- Christopher DuRoss
- Ryan Gold
- Shannon Mahan
- Steve Personius
- Nadine Reitman
Release Date: FEBRUARY 1, 2015
Paleoseismology along the Wasatch Fault in Utah is helping to estimate the shaking risk to nearby towns.
Where is the Wasatch Fault?

The Wasatch Fault parallels the western base of the Wasatch Range for approximately 350 km (220 miles), from near Fayette, Utah in the south to near Malad City, Idaho in the north. The Wasatch Fault is also known as the Wasatch fault zone (WFZ) since it isn't a single long fault, but rather a series of fault segments. It's no coincidence that the fault parallels the mountains; the mountains were created during the last several million years by many earthquakes along the fault zone.
The Wasatch fault zone quakes occur on normal faults that dip at an angle under the valley to the west. Repeated fault movements during earthquakes have formed the mountains to the east and the valleys to the west.
The WFZ marks the boundary between the Basin and Range Province to the west, an area being slowly pulled apart in an east-west direction, and the Middle Rocky Mountains and Colorado Plateau regions to the east, more stable areas thought to have fewer active faults.
What do we already know?

For over a century, geologists have documented tectonic fault scarps along the Wasatch fault zone. In the 1880s, renowned geologist G.K. Gilbert first reported fault scarps at the mouth of Little Cottonwood Canyon, approximately 20 km (12 miles) south of downtown Salt Lake City, and suggested the scarps were evidence of prehistoric ground-rupturing earthquakes. Today there is a park at this locationcommemorating Gilbert's work and showcasing the geological features.
Since 1979, paleoseismologists, scientists who study past earthquakes, have excavated numerous paleoseismic trenches along the WFZ (white stars on the location map, at right), with the goal of documenting the timing and frequency of past earthquakes (see Paleoseismology of Utah Series, Utah Geological Survey). Paleoseismologists used this information about the recent past to provide insight into the frequency of future earthquakes and ground shaking, for example, as with the 2014 USGS National Seismic Hazard Maps. In connection with the trenching work, geologists produced detailed maps of the Wasatch fault trace and the rock units and young alluvial deposits that it cuts.

Together, these contributions led to the subdivision of the WFZ into 10 structural fault segments, each approximately 30-60 km (19-37 miles) long. The central five fault segments have been active during Holocene time (the last 10,000 years) and produce large (magnitude 7.0) earthquakes about every 900-1300 years. The most recent earthquake on fault segments near Weber, Provo, and Nephi occurred 200-700 years ago. The most recent earthquake on the Salt Lake City segment occurred 1200-1600 years ago. It has been 2200-2800 years since the most recent earthquake on the Brigham City fault segment.
What is still unknown?
Paleoseismologic studies have provided a detailed record of Holocene earthquakes on the WFZ. This record generally suggests that individual magnitude 7.0 earthquake ruptures have been limited to one of the approximately 30-60 km-long fault segments. However, in a few cases, the data could also be interpreted as multi-segment ruptures on the WFZ, where rupture spanned a segment boundary.
Multi-segment earthquake ruptures on the WFZ may have produced longer surface ruptures and generated larger (magnitude 7.4) earthquakes; however, they may also result in less frequent and fewer total surface-rupturing earthquakes. The extent and frequency of ruptures that span segment boundaries remain poorly known, adding uncertainty to seismic hazard models for this populated region of Utah.

What are we doing?
A team of scientists from the USGS Geological Hazards Science Center, led by Mendenhall Postdoctoral Fellow Scott Bennett and Research Geologists Ryan Gold, Richard Briggs, Christopher DuRoss, and Stephen Personius are collaborating with scientists at the Utah Geological Survey to gather data from new paleoseismic trenches along the Wasatch fault zone. These new datasets will help researchers to understand if past surface-rupturing earthquakes have spanned fault segment boundaries. They are also analyzing new high-resolution airborne LiDAR topographic data to characterize previously unmapped fault traces and to measure how vertical displacements (vertical offset of the ground surface from faulting) vary, both in space (from north to south) and time (the last 20,000 years).
Down in the Trenches - Paleoseismology
The USGS and collaborators are excavating trenches near the Salt Lake City-Provo and Provo-Nephi fault segment boundaries (yellow arrows on the map below). These trenches near fault segment boundaries can provide critical information about the length and displacement of past earthquakes. These data will also allow the researchers to figure out if past earthquakes repeatedly stop at a fault segment boundary or sometimes break through.
Preliminary observations include evidence for four to seven Holocene earthquakes at each trenching site. Ongoing geochronologic analysis will help determine the timing of these earthquakes. The timing of these earthquakes will be compared to earthquakes observed in trenches on adjacent fault segments to help identify through-going ruptures across segment boundaries.
Up in the Air - Lidar Analysis
Lidar, which stands for Light Detection And Ranging, is a remote sensing method that uses laser pulses, usually from a specially-equipped airplane, to create detailed topographic maps of Earth's surface. Lidar is able to "see through" the vegetation to record ground elevations and is a much faster and more precise way to gather topographical data than collecting data with a ground survey.
The USGS, in collaboration with the Utah Geological Survey, Federal Emergency Management Agency (FEMA), Utah Division of Emergency Management, Salt Lake County Surveyor's office and partner cities, has acquired 3,683 sq. km (approx. 1,400 sq. miles) of new high-resolution (8 points per sq. meter) airborne lidar topographic data along the entire WFZ. These data are available to the public. Detailed bare-earth digital elevation models (DEMs) and hillshade models of these LiDAR data allow the scientists to identify previously unmapped fault traces, providing a more complete story of Holocene earthquake ruptures on the WFZ.
Analysis of the lidar data helps quantify fault displacements and slip rates, allows scientists to estimate the extent of fault ruptures associated with most recent earthquakes, and documents spatial and temporal slip patterns near fault segment boundaries.
Preliminary observations identify numerous previously undocumented fault scarps, including recent scarps north of Ogden, UT that may correspond with a late Holocene rupture that spanned the Brigham City-Weber fault segment boundary, as previously suggested from nearby paleoseismic trench studies.


In the Trenches on a Paleoseismology Project

What's really involved in planning and completing a paleoseismology project like this one on the Wasatch fault zone? It's more time-consuming and interesting than you might think.
Selecting and Preparing the Site
The first order of business is selecting a trench site. The trench site location depends on the scientific questions to be answered and the ability to gain permission to dig a trench at the site. In this Wasatch fault zone study, the scientists needed to select site locations that were near the end of known fault segments, so a good bit of staring at maps and wandering around in the field preceded site selection. After a few potential sites are identified, scientists need to get permission from the landowner to dig a paleoseismic trench across the fault; the land may be private property, or owned by the Local, State, or Federal government. Once permission is granted, a detailed topographic survey is completed to record the natural site conditions before any trenching is started.
Now it's time to bring in the excavator and dig the trench. A typical paleoseismology study onthe Wasatch fault zone requires a single trench about 40-50 meters (130-160 feet) long, 5 meters (16 feet) side, and up to 5 meters (16 feet) deep. A trench usually takes one day to excavate, although this time can vary depending on the size of the trench or if more than one trench is excavated.

As soon as the excavator does its job, the paleoseismologists get to work cleaning the walls of the trench, much like archeologists cleaning an archaeological site. They want to make the trench walls as "clean" as possible and to prepare a fresh geologic exposure of the sediment layers and the faults that cut and offset these layers. Preserved in the trench walls is the geologic and tectonic record of paleo-earthquakes at this location along the Wasatch fault zone.
The trench is ready now for the scientists to set up a coordinate system on the vertical walls of the trench so that all the information can be precisely recorded. String and nails are used to create a grid on the trench walls. These horizontal and vertical grid lines are spaced exactly 1 meter apart, like a graph-paper overlay. Next, detailed photos are taken of the entire extent of the trench walls and are pieced together to create a photo mosaic of the trench. In the past this task was done manually and took several dozen person-hours. Recently, new software automatically creates a photo mosaic with more accuracy and requires fewer person hours. The software also creates a 3-dimensional model of the trench that can be rotated and manipulated to reproduce a virtual trench that can be studied long after the real trench has been filled in. Once the trench grid is set and the trench photo mosaics are printed, paleoseismologists can begin logging the trench.


Interactive 3-D Model of Alpine Trench

Download and interact with 3-D model of the Alpine trench.
(6.3MB PDF, Adobe Reader required).
Photos by Kendra Johnson and Ed Nissen (Colorado School of Mines). Model created by Nadine Reitman. (If PDF opens a blank page in your browser, right/control-click on it and download it to your desktop.)
Time-Lapse Video of the Flat Canyon Trench Excavation
Down in the Trenches & Up in the Air - Collecting Data

The trench log is a map of the trench wall drawn on a small-scale paper print out of the trench photo mosaic. Paleoseismologists record details of the trench walls onto the trench logs. These details include the location and type of geologic contacts between layers of sediment (a.k.a. geologic units), the location and orientation of faults that cut these sediments, and any other evidence for ground shaking and failure during or after a large paleo-earthquake.
Careful descriptions of color, grain size, moisture, and density are recorded for each geologic unit. Samples of important geologic units are collected and sent to a laboratory to be age-dated. The geologic age of a sample is determined by various age-dating techniques, such as carbon-14 dating and luminescence dating.
The deformation of sediment, faults, and other features in the trench walls tell the sequential story of past earthquakes at that location, and age-dating informs paleoseismologists when the past earthquakes happened. Collecting all the data to reconstruct the story takes a team of scientists about two weeks in the trench, carefully recording everything onto the trench log. When the job is done they celebrate with a "trench party", where interested scientists and local citizens are invited to tour the trench and discuss the geologic interpretations before it is filled in.
As part of this Wasatch fault zone project, an airborne LiDAR topographic survey was conducted of the entire Wasatch fault zone. The LiDAR survey along the length of the fault took approximately 8 weeks of flying time between the Fall of 2013 and Spring of 2014.
LiDAR data provides a very high-resolution picture of Earth's surface so subtle features (like fault scarps) that may be missed during ground mapping can be identified from a bird's eye view. The laser scanner that does all the work is slightly larger than a large coffee can and is mounted to the underside of a small plane that flies back and forth over an area until the entire fault zone has been surveyed.
The laser pulses are able to penetrate vegetation and bounce off Earth's surface, so even if an area is covered with a dense forest, LiDAR is able to measure the surface elevation beneath the tree canopy.


Back at the Computer - Processing & Analyzing the Data

The point data collected from the LiDAR survey are processed to create a digital elevation model (DEM), a digital representation of the ground surface, similar to a topographic map. Shining a "digital light" onto the DEM, which simulates the early morning or late afternoon sun, creates a digital hillshade model that includes "fake shadows," which can reveal subtle topographic features such as fault scarps. USGS scientists use these hillshade models to identify several new fault traces that had never been noticed before.
The trench logs are also turned into a digital picture to illustrate the geologic relationships and to measure fault offset of geologic layers. Once the age-dating laboratory determines the ages of the geologic samples from the trench, that data is used to figure out when paleo-earthquakes occurred at that location.
In this Wasatch fault zone study, scientists are looking for paleo-earthquakes near the end of one fault segment that happened at the same time as paleo-earthquakes on the adjacent fault segment, indicating that the earthquake occurred on both fault segments. Such information would support that the paleo-earthquake could have been larger (and probably less frequent) than if it had happened only on a single fault segment.
-written by Lisa Wald, U.S. Geological Survey

For More Information
- Paleoseismology of the Hayward Fault
- New Information from Paleoseismology of the San Andreas Fault
- Utah Geological Survey
- The Wasatch Fault, Utah Geological Survey Public Information Series 40, 1996
- Paleoseismology of Utah Series, Utah Geological Survey
- Putting Down Roots in Earthquake Country
The Scientists Behind the Science
- Scott Bennett
- Richard Briggs
- Christopher DuRoss
- Ryan Gold
- Shannon Mahan
- Steve Personius
- Nadine Reitman

