
USGS studies the growth rates of corals at a network of coral growth assessment stations throughout Buck Island National Monument in St. Croix, U.S. Virgin Islands. These data provide resource managers with information needed to understand how coral populations are doing in the park.
Images
Images intro.
Filter Total Items: 7053

Elkhorn Coral Colonies
USGS studies the growth rates of corals at a network of coral growth assessment stations throughout Buck Island National Monument in St. Croix, U.S. Virgin Islands. These data provide resource managers with information needed to understand how coral populations are doing in the park.

Studying precariously balanced rocks in northeastern U.S.
Photo of a precariously balanced rock by Noah Lindberg from the northeastern U.S. taken during field work in August, 2022.
Photo of a precariously balanced rock by Noah Lindberg from the northeastern U.S. taken during field work in August, 2022.

Studying precariously balanced rocks in northeastern U.S.
Noah Lindberg and Thomas Pratt observe and measure features of a precariously balanced rock in the northeastern U.S.
Noah Lindberg and Thomas Pratt observe and measure features of a precariously balanced rock in the northeastern U.S.

Dos científicos del Servicio Geológico de los Estados Unidos instalando un equipo para sondeos de una costa
linkDos científicos del Servicio Geológico de los Estados Unidos instalando un equipo para sondeos de una costa en Dorado, Puerto Rico. Este equipo monitoreará como la playa y la línea costera cambian a través del tiempo. Imagen de USGS.
USGS scientists set-up equipment on beach
Two U.S. Geological Survey scientists set-up equipment to survey a beach in Dorado, Puerto Rico. This equipment will monitor how the beach and shoreline change through time. USGS Image.
Two U.S. Geological Survey scientists set-up equipment to survey a beach in Dorado, Puerto Rico. This equipment will monitor how the beach and shoreline change through time. USGS Image.

Debris-flow deposits downstream of the 2022 Pipeline Fire burn scar, north of Flagstaff, Arizona
linkDebris-flow deposits downstream of the 2022 Pipeline Fire burn scar, north of Flagstaff, Arizona.
Debris-flow deposits downstream of the 2022 Pipeline Fire burn scar, north of Flagstaff, Arizona
linkDebris-flow deposits downstream of the 2022 Pipeline Fire burn scar, north of Flagstaff, Arizona.

R/V Sallenger Tows SQUID-5 for 3D Seafloor Mapping
The R/V Sallenger tows the structure-from-motion quantitative underwater imaging device with 5 cameras (SQUID-5) across the water over Looe Key Reef in the Florida Keys.
The R/V Sallenger tows the structure-from-motion quantitative underwater imaging device with 5 cameras (SQUID-5) across the water over Looe Key Reef in the Florida Keys.

Studying Seafloor Erosion in the Florida Keys
Studying Seafloor Erosion in the Florida Keys
The challenge:
Studying Seafloor Erosion in the Florida Keys
The challenge:

Mount Rainier volcano hazards and lahar arrival times in Puyallup and Nisqually River valleys
Mount Rainier (Washington) volcano hazard zones and estimated lahar (volcanic mudflow) arrival times for the Puyallup and Nisqually River valleys.
Mount Rainier (Washington) volcano hazard zones and estimated lahar (volcanic mudflow) arrival times for the Puyallup and Nisqually River valleys.

Coral Reefs as National, Natural Infrastructure
Cover image for video featuring Curt Storlazzi, USGS titled, "Coral Reefs as National, Natural Infrastructure"
Cover image for video featuring Curt Storlazzi, USGS titled, "Coral Reefs as National, Natural Infrastructure"

Map of the M 3.5 - 6 km E of Elgin, South Carolina on June 29,2022
A map showing the epicenter of the M 3.5 quake that occurred 3.7 miles (6 km) east of Elgin, South Carolina on June 29, 2022. The quake is part of an ongoing sequence in central South Carolina. The sequence started on December 27, 2021, with an M3.3 earthquake near Lugoff, South Carolina.
A map showing the epicenter of the M 3.5 quake that occurred 3.7 miles (6 km) east of Elgin, South Carolina on June 29, 2022. The quake is part of an ongoing sequence in central South Carolina. The sequence started on December 27, 2021, with an M3.3 earthquake near Lugoff, South Carolina.

EXPRESS video cover image
Image showing NOAA research vessel with logos of NOAA, BOEM, USGS and MBARI. EXPRESS is a multi-year, multi-institution cooperative research campaign in deep sea areas of California, Oregon, and Washington, including the continental shelf and slope.
Image showing NOAA research vessel with logos of NOAA, BOEM, USGS and MBARI. EXPRESS is a multi-year, multi-institution cooperative research campaign in deep sea areas of California, Oregon, and Washington, including the continental shelf and slope.

Illustration of NOAA research vessel conducting multibeam sonar survey of seafloor
Illustration of NOAA research vessel conducting multibeam sonar survey of seafloor, courtesy of EXPRESS, or Expanding Pacific Research and Exploration of Submerged Systems.
Illustration of NOAA research vessel conducting multibeam sonar survey of seafloor, courtesy of EXPRESS, or Expanding Pacific Research and Exploration of Submerged Systems.

Restored staghorn coral (Acropora cervicornis) at Looe Key reef
Restored staghorn coral (Acropora cervicornis) at Looe Key reef in the lower Florida Keys outplanted by Mote Marine Laboratory's coral restoration program.
Restored staghorn coral (Acropora cervicornis) at Looe Key reef in the lower Florida Keys outplanted by Mote Marine Laboratory's coral restoration program.

Monte Cristo Fault, Nevada
Alex Hatem observes surface deformation from the 2020 Monte Cristo, Nevada, earthquake eroding away, June, 2022.
Alex Hatem observes surface deformation from the 2020 Monte Cristo, Nevada, earthquake eroding away, June, 2022.

USGS Ocean Research
Our coasts, the most familiar part of the ocean are the gateway to the larger deeper ocean world. USGS studies processes and hazards in the coastal zone and how they affect people, wildlife, and ecosystems.
Our coasts, the most familiar part of the ocean are the gateway to the larger deeper ocean world. USGS studies processes and hazards in the coastal zone and how they affect people, wildlife, and ecosystems.

Mendenhall Fellows Sabine Loos and Max Schneider
In June 2022, Mendenhall Fellow Sabine Loos (Research Civil Engineer in the Geological Hazards Science Center) presented a seminar to USGS's Earthquake Science Center at Moffett Field, CA, where Max Schneider (Research Statistician) works as a Mendenhall Fellow.
In June 2022, Mendenhall Fellow Sabine Loos (Research Civil Engineer in the Geological Hazards Science Center) presented a seminar to USGS's Earthquake Science Center at Moffett Field, CA, where Max Schneider (Research Statistician) works as a Mendenhall Fellow.

Looking Toward Monte Cristo Range, Nevada
Rich Briggs and Alex Hatem make geologic observations within Nevada’s Monte Cristo Range, June, 2022.
Rich Briggs and Alex Hatem make geologic observations within Nevada’s Monte Cristo Range, June, 2022.
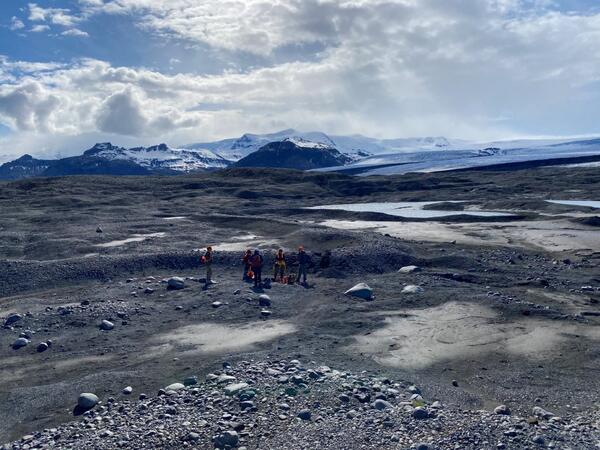
Researchers from the USGS, NASA, and NAU gather around a small simple esker and ephemeral lake deposits.
linkResearchers from the USGS, NASA, and NAU gather around a small simple esker and ephemeral lake deposits. The team used sedimentology, geochemistry, and remote sensing to characterize these features on Earth before comparing them to Mars.

Screenshot of the Coastal Change Hazards Portal showing historical shoreline change for Puerto Rico
linkThe USGS Coastal Change Hazards Portal contains an interactive map of historical shoreline positions and shoreline change rates for Puerto Rico.
Screenshot of the Coastal Change Hazards Portal showing historical shoreline change for Puerto Rico
linkThe USGS Coastal Change Hazards Portal contains an interactive map of historical shoreline positions and shoreline change rates for Puerto Rico.

Trayectorias de los huracanes, Puerto Rico
Trayectorias de los huracanes Hugo (1989), Georges (1998), Irma (2017) y María (2017). Datos provistos por la NOAA. La imagen de base es propiedad intelectual de Esri y se usa aquí bajo licencia. Los derechos de autor y reproducción son propiedad de Esri y sus licenciatarios.
Trayectorias de los huracanes Hugo (1989), Georges (1998), Irma (2017) y María (2017). Datos provistos por la NOAA. La imagen de base es propiedad intelectual de Esri y se usa aquí bajo licencia. Los derechos de autor y reproducción son propiedad de Esri y sus licenciatarios.