Interactive UAS Science Exhibit on display in Reston
Included in this display are some of the earliest UAS platforms operated by the USGS and an interactive touch screen table that provides access to additional information and videos.

Official websites use .gov
A .gov website belongs to an official government organization in the United States.
Secure .gov websites use HTTPS
A lock () or https:// means you’ve safely connected to the .gov website. Share sensitive information only on official, secure websites.
Images from USGS Chesapeake Bay reports and field activities are available to visualize and help translate the science. They are available for your use, just please cite the USGS as the source of respective images.

Interactive UAS Science Exhibit on display in Reston
Included in this display are some of the earliest UAS platforms operated by the USGS and an interactive touch screen table that provides access to additional information and videos.
Interactive UAS Science Exhibit on display in Reston
Included in this display are some of the earliest UAS platforms operated by the USGS and an interactive touch screen table that provides access to additional information and videos.

War Branch is a tributary of Smith Creek in the Shenandoah Valley. This location is a part of the Small Agricultural Watersheds monitoring project.
War Branch is a tributary of Smith Creek in the Shenandoah Valley. This location is a part of the Small Agricultural Watersheds monitoring project.

Phosphate discharged from the Susquehanna River to the Chesapeake Bay could be derived, in part, by desorption from legacy sediments accumulated in impoundments along the lower reaches of the river owing to increasing pH of the river water over recent decades.
Phosphate discharged from the Susquehanna River to the Chesapeake Bay could be derived, in part, by desorption from legacy sediments accumulated in impoundments along the lower reaches of the river owing to increasing pH of the river water over recent decades.

The stream gage at the Difficult Run Near Great Falls, VA monitoring station. This site is a part of the USGS Nontidal Network.
The stream gage at the Difficult Run Near Great Falls, VA monitoring station. This site is a part of the USGS Nontidal Network.

Water quality monitoring sondes installed at Difficult Run Near Great Falls, VA. Part of the USGS nontidal network.
Water quality monitoring sondes installed at Difficult Run Near Great Falls, VA. Part of the USGS nontidal network.

A USGS hydrotech uses a water quality sonde to measure conditions at Accotink Creek Near Annandale, VA. This monitoring station is part of the USGS nontidal network.
A USGS hydrotech uses a water quality sonde to measure conditions at Accotink Creek Near Annandale, VA. This monitoring station is part of the USGS nontidal network.

Accotink Creek is an urban creek in the Potomac watershed. Like many urban streams, it suffers from bank erosion, leading to high suspended sediment loads, steep banks, and fallen trees.
Accotink Creek is an urban creek in the Potomac watershed. Like many urban streams, it suffers from bank erosion, leading to high suspended sediment loads, steep banks, and fallen trees.

A water quality sampling bottle used to collect samples from S F Quantico Creek Near Independent Hill, VA. This site is part of the USGS nontidal network.
A water quality sampling bottle used to collect samples from S F Quantico Creek Near Independent Hill, VA. This site is part of the USGS nontidal network.

A USGS hydrotech conducts horizontally-integrated synoptic water quality sampling at Accotink Creek Near Annandale, VA.
A USGS hydrotech conducts horizontally-integrated synoptic water quality sampling at Accotink Creek Near Annandale, VA.

A USGS hydrologist conducts horizontally-integrated synoptic water sampling of the James River at Cartersville as part of the USGS's nontidal network monitoring efforts.
A USGS hydrologist conducts horizontally-integrated synoptic water sampling of the James River at Cartersville as part of the USGS's nontidal network monitoring efforts.

The animation in the figure shows aerial imagery from Anne Arundel County, Maryland, collected by National Agricultural Imagery Program (NAIP), followed by 1-meter Chesapeake Bay Land Cover (13 classes) and Land Use/Land Cover (54 classes) data products.
The animation in the figure shows aerial imagery from Anne Arundel County, Maryland, collected by National Agricultural Imagery Program (NAIP), followed by 1-meter Chesapeake Bay Land Cover (13 classes) and Land Use/Land Cover (54 classes) data products.

An illustration of updated short-term nitrogen and phosphorous trends in the Chesapeake Bay
An illustration of updated short-term nitrogen and phosphorous trends in the Chesapeake Bay

Summary of long-term (1985-2021) and short-term (2012-2021) trends in nitrogen, phosphorus, and suspended-sediment loads for the River Input Monitoring stations. “Improving” or “Degrading” trends are classified as likelihood estimates greater than or equal to 67 percent, whereas “No trend” estimates are greater than 33 and less than 67 percent.
Summary of long-term (1985-2021) and short-term (2012-2021) trends in nitrogen, phosphorus, and suspended-sediment loads for the River Input Monitoring stations. “Improving” or “Degrading” trends are classified as likelihood estimates greater than or equal to 67 percent, whereas “No trend” estimates are greater than 33 and less than 67 percent.
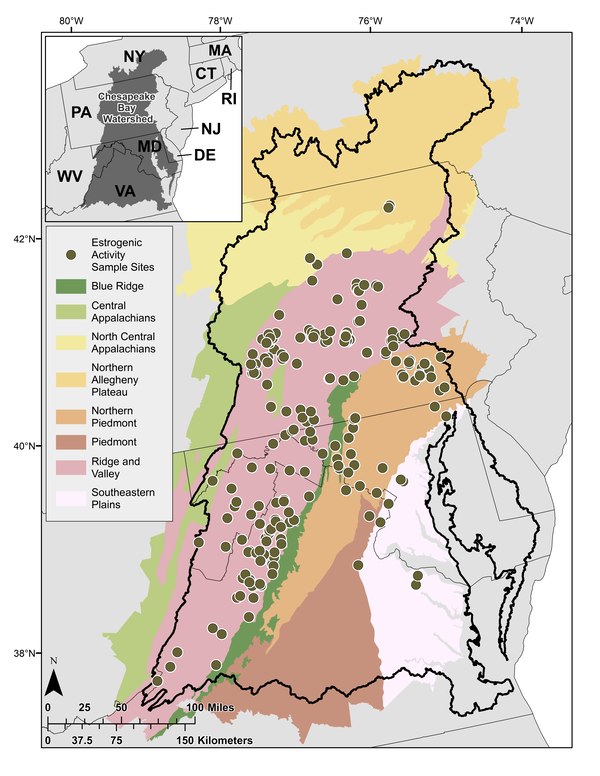
Surface water sampling locations (n = 244) in the Chesapeake Bay Watershed shown with EPA Level 3 Ecoregions.
Surface water sampling locations (n = 244) in the Chesapeake Bay Watershed shown with EPA Level 3 Ecoregions.

Impairments in Linganore Creek in Maryland (top) and Little Conestoga Creek in Pennsylvania (bottom) caused by altered geomorphology and high nutrients from sedimentation and agricultural runoff.
Impairments in Linganore Creek in Maryland (top) and Little Conestoga Creek in Pennsylvania (bottom) caused by altered geomorphology and high nutrients from sedimentation and agricultural runoff.

Collecting water quality samples from the New River Gorge in support of USGS-NPS partnership.
Fall 2022 Photo Contest Winner: Matt Kearns, USGS at Work category
Collecting water quality samples from the New River Gorge in support of USGS-NPS partnership.
Fall 2022 Photo Contest Winner: Matt Kearns, USGS at Work category

New development (red, black, yellow) near the towns of Waldorf and La Plata in Charles County, Maryland from 2014-2018.
New development (red, black, yellow) near the towns of Waldorf and La Plata in Charles County, Maryland from 2014-2018.

Forest harvested for timber (brown) in southwest Cumberland County, Virginia from 2014-2018.
Forest harvested for timber (brown) in southwest Cumberland County, Virginia from 2014-2018.

Forests in this area of Louisa County, Virginia were recently cleared for timber (brown) and for the development of solar fields (yellow).
Forests in this area of Louisa County, Virginia were recently cleared for timber (brown) and for the development of solar fields (yellow).

Differential leveling techniques are performed by Alex Wong to determine reference-mark elevations at historic USGS streamgage, 01303000 Mill Neck Creek in Mill Neck, NY.
Summer 2022 Photo Contest Winner: Amy Simonson, Where We Work category
Differential leveling techniques are performed by Alex Wong to determine reference-mark elevations at historic USGS streamgage, 01303000 Mill Neck Creek in Mill Neck, NY.
Summer 2022 Photo Contest Winner: Amy Simonson, Where We Work category
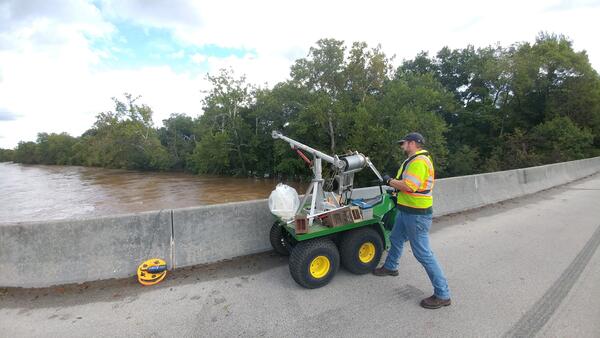
Doug Moyer capturing an elevated stage (storm-impacted) water quality sample at the South Fork Shenandoah River near Lynnwood, VA
Doug Moyer capturing an elevated stage (storm-impacted) water quality sample at the South Fork Shenandoah River near Lynnwood, VA