
Doug Moyer capturing an elevated stage (storm-impacted) water quality sample at the South Fork Shenandoah River near Lynnwood, VA
Images
Images from USGS Chesapeake Bay reports and field activities are available to visualize and help translate the science. They are available for your use, just please cite the USGS as the source of respective images.
Filter Total Items: 64
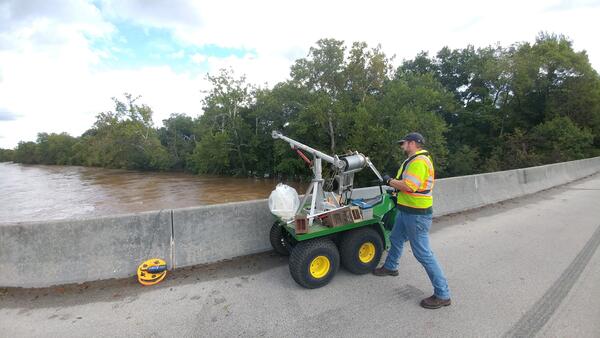
Capturing an elevated stage (storm-impacted) water quality sample
Doug Moyer capturing an elevated stage (storm-impacted) water quality sample at the South Fork Shenandoah River near Lynnwood, VA

Downstream side of the Conowingo Dam on the Susquehanna River
Downstream side of the Conowingo (hydroelectric) Dam on the Susquehanna River in Conowingo, Maryland.
Summer 2022 Photo Contest Winner: Nicholas Giro, Honorable Mention category
Downstream side of the Conowingo (hydroelectric) Dam on the Susquehanna River in Conowingo, Maryland.
Summer 2022 Photo Contest Winner: Nicholas Giro, Honorable Mention category

Matt Burgess pilots a drone over research ponds
Matt Burgess from the USGS National Uncrewed Systems Office pilots a drone over research ponds at the Eastern Ecological Science Center as part of a methods development campaign to examine how multiple types of remote sensors may be used to map and identify algae, including those that lead to Harmful Algal Blooms.
Matt Burgess from the USGS National Uncrewed Systems Office pilots a drone over research ponds at the Eastern Ecological Science Center as part of a methods development campaign to examine how multiple types of remote sensors may be used to map and identify algae, including those that lead to Harmful Algal Blooms.

Chesapeake Bay Land Use Map and Chart
Land use (2016) in the immediate (insert) and upstream catchments around the smallmouth bass, Antietam Creek – Potomac Mainstem collection site near Dargan, Maryland.
Land use (2016) in the immediate (insert) and upstream catchments around the smallmouth bass, Antietam Creek – Potomac Mainstem collection site near Dargan, Maryland.

Chart of changes in smallmouth bass
Annual and seasonal changes in plasma vitellogenin (Vtg) and hepatic vitellogenin (vtg) gene transcripts in A) female and B) male smallmouth bass. C) Prevalence and severity of testicular oocytes (TO) in male smallmouth bass.
Annual and seasonal changes in plasma vitellogenin (Vtg) and hepatic vitellogenin (vtg) gene transcripts in A) female and B) male smallmouth bass. C) Prevalence and severity of testicular oocytes (TO) in male smallmouth bass.

Chart of concentrations of three of the most detected pesticides in Dargan, MD
Concentrations of three of the most detected pesticides (simazine, atrazine, and metolachlor) sampled near the confluence of Antietam Creek and the Potomac River in Dargan, Maryland, 2013-2019. Dots represent smallmouth bass sampling dates.
Concentrations of three of the most detected pesticides (simazine, atrazine, and metolachlor) sampled near the confluence of Antietam Creek and the Potomac River in Dargan, Maryland, 2013-2019. Dots represent smallmouth bass sampling dates.

Cable way Acoustic Doppler current profilers
Cable way Acoustic Doppler current profilers
Photo Contest Winner | Spring 2022 | Honorable Mention 2
Cable way Acoustic Doppler current profilers
Photo Contest Winner | Spring 2022 | Honorable Mention 2

Nick Giro at Potomac River overlooking Washington, DC
Nick Giro at Potomac River overlooking Washington, DC
Photo Contest Winner | Spring 2022 | People
Nick Giro at Potomac River overlooking Washington, DC
Photo Contest Winner | Spring 2022 | People

Soaking up stormwater infographic
Infographic summarizing the main lessons learned from a USGS study in Clarksburg, Maryland assessing the impacts of distributed stormwater management on stream health.
Infographic summarizing the main lessons learned from a USGS study in Clarksburg, Maryland assessing the impacts of distributed stormwater management on stream health.

Map of Potomac River basin
The study area within the Potomac River basin of eastern North America. Open circles show sample site locations on streams within the C&O Canal National Historical Park. Shaded areas show physiographic regions within Maryland from west to east as the Ridge and Valley, Blue Ridge, and Piedmont, and the stippled areas show regions of karst geology.
The study area within the Potomac River basin of eastern North America. Open circles show sample site locations on streams within the C&O Canal National Historical Park. Shaded areas show physiographic regions within Maryland from west to east as the Ridge and Valley, Blue Ridge, and Piedmont, and the stippled areas show regions of karst geology.

Aerial view of Middle Patuxent, MD in winter
Photo Contest Winner | Winter 2022 | Where We Work
Aerial view of Middle Patuxent, MD in winter
Photo Contest Winner | Winter 2022 | Where We Work
Aerial view of Middle Patuxent, MD in winter

Conceptual diagram illustrating the multi-step approach to assess fish habitat
Conceptual diagram illustrating the multi-step approach to assess fish habitat in non-tidal reaches of the Chesapeake Bay watershed.
Conceptual diagram illustrating the multi-step approach to assess fish habitat in non-tidal reaches of the Chesapeake Bay watershed.

Map of the Chesapeake Bay watershed with location of community samples identified by habitat size and aggregated ecoregions
linkMap of the Chesapeake Bay watershed with location of community samples identified by habitat size and aggregated ecoregions. Inset show study area relative to the northeastern USA. Aggregated ecoregions include Coastal Plains (CPL), Northern Appalachians (NAP), Southern Appalachians Northwest (SAPNW), and Southern Appalachians Piedmont (SAPPIED).

Community index score of stream condition
Community metric index score of stream condition (mean metric decile) for 2001, 2006, 2011, and 2016. Higher values (teal shades) indicate less altered conditions while lower values indicate a higher degree of alteration (brown shades).
Community metric index score of stream condition (mean metric decile) for 2001, 2006, 2011, and 2016. Higher values (teal shades) indicate less altered conditions while lower values indicate a higher degree of alteration (brown shades).

Maps showing predicted occurrence for four species in 2016
Maps showing predicted occurrence for the four species of interest in 2016. BRT = Brook Trout, NHS = Northern Hog Sucker, SMB = Smallmouth Bass, TRS = Torrent Sucker. NA infers reach was outside modeling extent for that species.
Maps showing predicted occurrence for the four species of interest in 2016. BRT = Brook Trout, NHS = Northern Hog Sucker, SMB = Smallmouth Bass, TRS = Torrent Sucker. NA infers reach was outside modeling extent for that species.

Map showing change in aggregated ecoregion-specific selected mean metric deciles from 2001 to 2016
linkMap showing change in aggregated ecoregion-specific selected mean metric deciles from 2001 to 2016 (negative indicates more altered) for nontidal stream reaches in the Chesapeake Bay watershed. Insets show two focus areas to better highlight changes.

Amphibian research technician with begrudgingly cooperative salamander
Photo Contest Winner | Winter 2022 | Honorable Mention 1
Amphibian research technician with begrudgingly cooperative salamander
Photo Contest Winner | Winter 2022 | Honorable Mention 1
Amphibian research technician with begrudgingly cooperative salamander

Robert (Bo) Bales works on a Aquadopp for deployment
Photo Contest Winner | September 2021 | People
Robert (Bo) Bales works on a Aquadopp for deployment
Photo Contest Winner | September 2021 | People
Robert (Bo) Bales works on a Aquadopp for deployment

Conceptual diagram showing the major mechanisms of the fate, transport, and exposure pathways of PFAS
linkConceptual diagram showing the major mechanisms of the fate, transport, and exposure pathways of perfluoroalkyl and polyfluoroalkyl substances (PFAS) in the environment.
Conceptual diagram showing the major mechanisms of the fate, transport, and exposure pathways of PFAS
linkConceptual diagram showing the major mechanisms of the fate, transport, and exposure pathways of perfluoroalkyl and polyfluoroalkyl substances (PFAS) in the environment.

Annual nitrogen loads exported to the Chesapeake Bay by source
Annual nitrogen loads exported to the Chesapeake Bay by source, 1950–2050. Fertilizer and manure are combined into a single agricultural source for the modeled time period.
Annual nitrogen loads exported to the Chesapeake Bay by source, 1950–2050. Fertilizer and manure are combined into a single agricultural source for the modeled time period.

Nitrogen in the Chesapeake Bay Watershed—A Century of Change, 1950–2050 cover
Nitrogen in the Chesapeake Bay Watershed—A Century of Change, 1950–2050 cover
Nitrogen in the Chesapeake Bay Watershed—A Century of Change, 1950–2050 cover