
Landsat 8 nighttime thermal infrared image of Yellowstone from 28 January 2022. Inset images are zoomed in on the area outlined by the white square. Inset image (A) has the raw data values, which range from 9070 to 21284. Inset image (B) shows the same image converted to spectral radiance, where values range from 3.13 to 7.21 W/m2/micron
Images
Images of Yellowstone.
Filter Total Items: 502

Landsat 8 nighttime thermal infrared image of Yellowstone from 28 January 2022
Landsat 8 nighttime thermal infrared image of Yellowstone from 28 January 2022. Inset images are zoomed in on the area outlined by the white square. Inset image (A) has the raw data values, which range from 9070 to 21284. Inset image (B) shows the same image converted to spectral radiance, where values range from 3.13 to 7.21 W/m2/micron

Seismicity in the Yellowstone region during 2021
Map of seismicity (red circles) in the Yellowstone region during 2021. Gray lines are roads, black dashed line shows the caldera boundary, Yellowstone National Park is outlined by black dot-dashed line, and gray dashed lines denote state boundaries.
Map of seismicity (red circles) in the Yellowstone region during 2021. Gray lines are roads, black dashed line shows the caldera boundary, Yellowstone National Park is outlined by black dot-dashed line, and gray dashed lines denote state boundaries.

Siliceous sinter in the field and viewed via Scanning Electron Microscope
Left photo shows a loose piece of siliceous sinter that was precipitated around a photosynthetic microbial mat in the Lower Geyser Basin. The microbial mat died when the outflow channel changed positions.
Left photo shows a loose piece of siliceous sinter that was precipitated around a photosynthetic microbial mat in the Lower Geyser Basin. The microbial mat died when the outflow channel changed positions.

Castle Geyser features and Scanning Electron Microscope image of algal filament in a silica sheath
linkOn the left is Castle Geyser during an eruption with a pool from nearby Tortoise Shell Spring showing photosynthetic pigments at the bottom. The middle image is of a small pool in the Geyser Hill Group in the Upper Geyser Basin with an outflow channel full of yellow, green, orange, red, and brown pigmented phototrophic microbial mats.
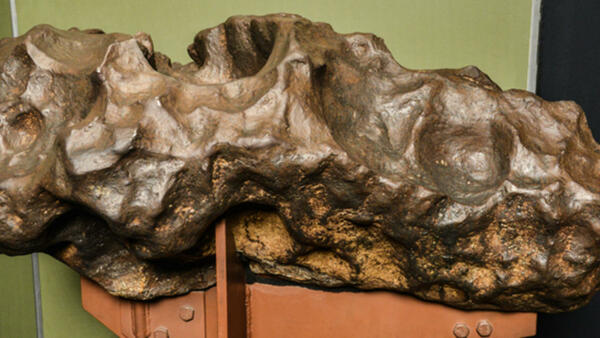
A 200-kilogram (440-pound) fragment of the Canyon Diablo meteorite that was found at Meteor Crater in Arizona
linkA 200-kilogram (440-pound) fragment of the Canyon Diablo meteorite that was found at Meteor Crater in Arizona.
A 200-kilogram (440-pound) fragment of the Canyon Diablo meteorite that was found at Meteor Crater in Arizona
linkA 200-kilogram (440-pound) fragment of the Canyon Diablo meteorite that was found at Meteor Crater in Arizona.

Map of the Uhl Hill fault in eastern Grand Teton National Park, Wyoming
Map of the Uhl Hill fault in eastern Grand Teton National Park. Base map is a 1-meter lidar hillshade. Black arrows mark the visible fault scarp, and red lines mark locations where scarp profiles were generated from lidar data or field surveying.
Map of the Uhl Hill fault in eastern Grand Teton National Park. Base map is a 1-meter lidar hillshade. Black arrows mark the visible fault scarp, and red lines mark locations where scarp profiles were generated from lidar data or field surveying.

Scarp of the Uhl Hill fault in eastern Grand Teton National Park, Wyoming
Scarp of the Uhl Hill fault. Photo (top) is looking west at the east-facing fault scarp, with a geologist at the top of the scarp for scale. Here, the fault cuts through Pinedale-1 glacial deposits just south of a Pinedale-2 end moraine. Plot (bottom) is a scarp profile generated from lidar elevation data.
Scarp of the Uhl Hill fault. Photo (top) is looking west at the east-facing fault scarp, with a geologist at the top of the scarp for scale. Here, the fault cuts through Pinedale-1 glacial deposits just south of a Pinedale-2 end moraine. Plot (bottom) is a scarp profile generated from lidar elevation data.

Difference in mapped rock units for Mount Everts, Yellowstone National Park
Simplified geologic maps showing the difference in mapped rock units from the current, large-scale geologic maps dividing Mount Everts and that join along the boundary between Montana and Wyoming.
Simplified geologic maps showing the difference in mapped rock units from the current, large-scale geologic maps dividing Mount Everts and that join along the boundary between Montana and Wyoming.

Reconstructed fossil horse skeleton found at Hagerman Fossil Beds National Monument, Idaho
Reconstructed fossil horse skeleton found at Hagerman Fossil Beds National Monument, Idaho. National Park Service photo, https://www.nps.gov/articles/000/equus_simplicidens.htm.
Reconstructed fossil horse skeleton found at Hagerman Fossil Beds National Monument, Idaho. National Park Service photo, https://www.nps.gov/articles/000/equus_simplicidens.htm.

Colloidal_Pool_maps_and_photos.png
Comparison of (a) 1904 Historical map with (b) 1988 USGS map. Colloidal Pool is a large, labeled pool roughly located on a straight line between Hurricane vent and Whirligig Geyser on the 1988 map (b); this same transect on the 1904 map (a) shows no feature at that location (white circle).
Comparison of (a) 1904 Historical map with (b) 1988 USGS map. Colloidal Pool is a large, labeled pool roughly located on a straight line between Hurricane vent and Whirligig Geyser on the 1988 map (b); this same transect on the 1904 map (a) shows no feature at that location (white circle).

SEM_Colloidal_poolpng.png
Scanning electron microscopy (SEM) images of the Colloidal Pool colloids (images are a combination of backscatter and secondary electrons). The colloids are a mixture of clay particles, hydrated silica, alunite, and diatoms.
Scanning electron microscopy (SEM) images of the Colloidal Pool colloids (images are a combination of backscatter and secondary electrons). The colloids are a mixture of clay particles, hydrated silica, alunite, and diatoms.

Thin section photo of Lava Creek Tuff “unit 2"
Microscope thin-section photo of Lava Creek Tuff “unit 2.” Photo by Ray Salazar (Montana State University) on October 28, 2021.
Microscope thin-section photo of Lava Creek Tuff “unit 2.” Photo by Ray Salazar (Montana State University) on October 28, 2021.

Different views of an eruption from two predictable geysers
Different views of an eruption from two predictable geysers. (a, c) Graphs showing water temperatures recorded by data loggers stationed near Beehive and Old Faithful Geysers, respectively. These data loggers were deployed by the Yellowstone Geology Program, configured to capture temperatures at one-minute intervals (indicated by blue dots).
Different views of an eruption from two predictable geysers. (a, c) Graphs showing water temperatures recorded by data loggers stationed near Beehive and Old Faithful Geysers, respectively. These data loggers were deployed by the Yellowstone Geology Program, configured to capture temperatures at one-minute intervals (indicated by blue dots).

Example initial analyses on the water temperature data
Example initial analyses on the water temperature data. (a, c) Graphs showing the calculated time between eruptions. (b, d) Histograms demonstrating the distribution of eruption intervals.
Example initial analyses on the water temperature data. (a, c) Graphs showing the calculated time between eruptions. (b, d) Histograms demonstrating the distribution of eruption intervals.

Research Vessel Annie and Remotely Operated Vehicle Yogi
Research Vessel Annie and Remotely Operated Vehicle Yogi. a) R/V Annie on Yellowstone Lake operated by the Global Foundation for Ocean Exploration. Image Rob Harris, OSU. b) ROV Yogi with GFOE President Dave Lovalvo. Image Todd Gregory, GFOE. C) ROV Yogi and 1-m heat flow probe. This pr
Research Vessel Annie and Remotely Operated Vehicle Yogi. a) R/V Annie on Yellowstone Lake operated by the Global Foundation for Ocean Exploration. Image Rob Harris, OSU. b) ROV Yogi with GFOE President Dave Lovalvo. Image Todd Gregory, GFOE. C) ROV Yogi and 1-m heat flow probe. This pr

Yellowstone Lake map showing the location of the Deep Hole vent field
Yellowstone Lake bathymetry showing the location of the Deep Hole vent field. Inset shows locations of heat-flux measurements (red dots) in the Deep Hole vent field.
Yellowstone Lake bathymetry showing the location of the Deep Hole vent field. Inset shows locations of heat-flux measurements (red dots) in the Deep Hole vent field.

Earth Explorer web tool showing example of search criteria
Screen shot of the USGS Earth Explorer web tool showing an example of the geographic area and date range search criteria for Yellowstone.
Screen shot of the USGS Earth Explorer web tool showing an example of the geographic area and date range search criteria for Yellowstone.

USGS Earth Explorer screen shot showing Data Sets to search example
USGS Earth Explorer screen shot showing example of selecting the Data Sets to search.
USGS Earth Explorer screen shot showing example of selecting the Data Sets to search.

USGS Earth Explorer screen shot with Landsat 8 data from Yellowstone
USGS Earth Explorer screen shot showing example of Landsat 8 search results over Yellowstone.
USGS Earth Explorer screen shot showing example of Landsat 8 search results over Yellowstone.

Site of the former Fountain Hotel in Yellowstone National Park
Site of the former Fountain Hotel in Yellowstone National Park. Red arrows indicate the location of the pipe that ran through the meadow between Leather Pool and the site of the Fountain Hotel (yellow arrow). Yellowstone National Park photo by Annie Carlson, October 2021.
Site of the former Fountain Hotel in Yellowstone National Park. Red arrows indicate the location of the pipe that ran through the meadow between Leather Pool and the site of the Fountain Hotel (yellow arrow). Yellowstone National Park photo by Annie Carlson, October 2021.

Shaded relief map of Henrys Fork Caldera and vicinity
Shaded relief map of Henrys Fork Caldera and vicinity. The margin of Henrys Fork Caldera is shown in blue. Note the smooth, low-relief topography within the caldera compared to the steep and dynamic topography associated with Yellowstone Caldera (at the right side of the image).
Shaded relief map of Henrys Fork Caldera and vicinity. The margin of Henrys Fork Caldera is shown in blue. Note the smooth, low-relief topography within the caldera compared to the steep and dynamic topography associated with Yellowstone Caldera (at the right side of the image).