
Spring 2024 Newsletter - In The Flow - Maryland-Delaware-DC Water Science Center
The USGS In The Flow newsletter focuses on water science issues in the Maryland, Delaware, and Washington, D.C. region.
"Every river has a story to tell" - Meet the Geomorphology Team
Our science supports the development of more resilient watersheds through our understanding of hydrologic and geomorphic processes.
A landscape is not static, and as it changes, it leaves behind clues of what happened in the past. The USGS Geomorphology team in Maryland uses cutting edge science to learn more about the history of our landscape, its present-day qualities, and helps inform water landscape planning such as stream restoration efforts.
Recent work includes:
- Measurement of stream erosion related to urban development, storm events, and land-use legacies using lidar technology.
- The use of remote sensing to assess changes in the lower Patapsco River streambanks and floodplain using remote sensing, following the removal of multiple low-head dams.
- Hyperspectral identification and predictive modeling of harmful algal blooms.
- Monitoring and modeling the downstream fate of sediment via techniques such as sediment fingerprinting to determine sediment source.
For more information, please email Natalie Hall, Supervisory Geographer, at nhall@usgs.gov.
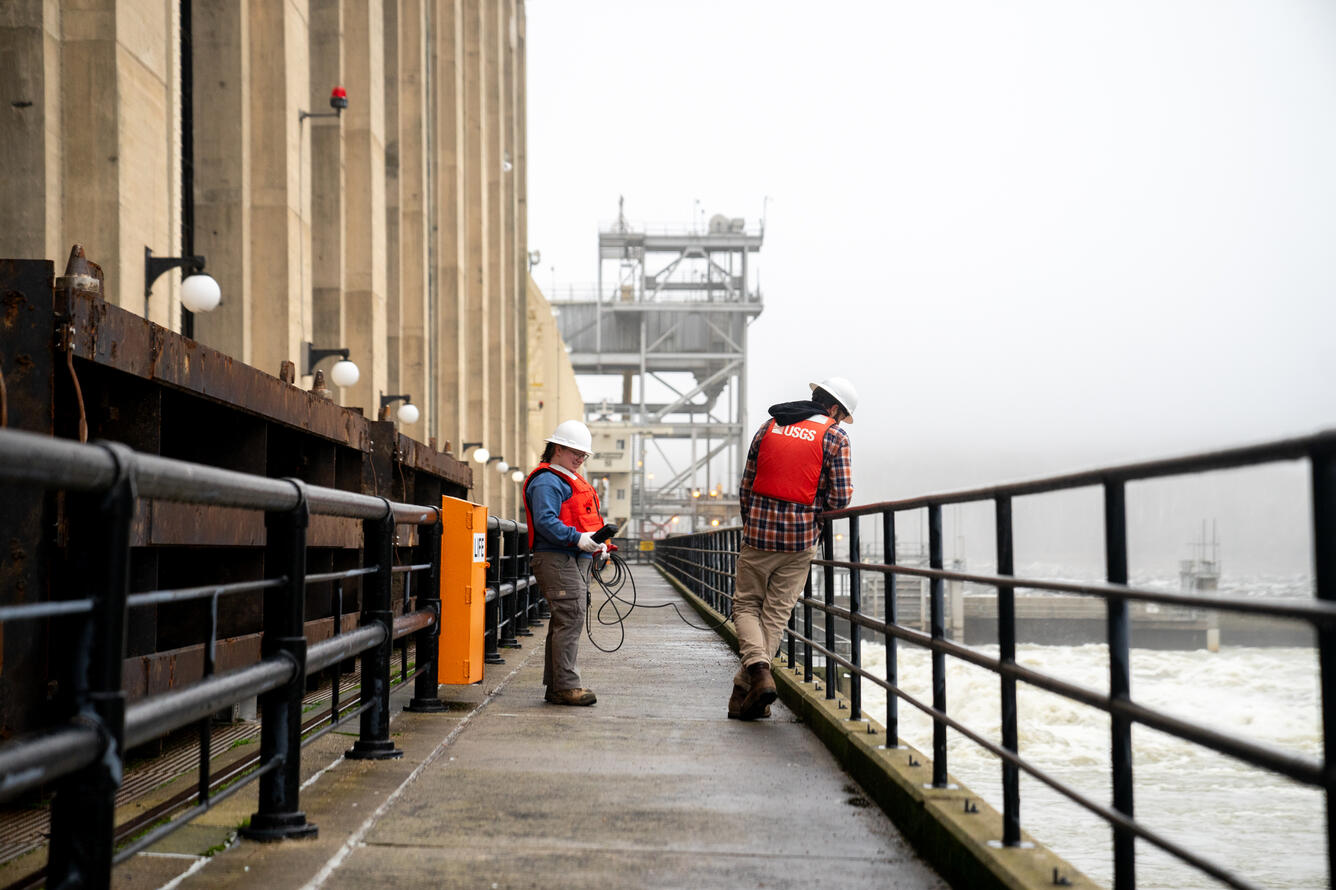
Site Spotlight: Conowingo Dam


The U.S. Geological Survey (USGS) operates a streamgage at the Susquehanna River at Conowingo, MD (01578310) on the Conowingo Dam. The gage measures the water level (gage height) to quantify the volume of water flowing through the site (discharge). The USGS has continuously collected data at Conowingo going back to 1967 and it is operated in cooperation with Exelon Corporation and the Maryland Department of Natural Resources.
The Conowingo Dam is located near the southern terminus of the Susquehanna River, draining a watershed that comprises over 27,100 square miles across New York, Pennsylvania, and Maryland. The Susquehanna River is the largest tributary impacting the Chesapeake Bay health, contributing to about half of the freshwater flow entering the Chesapeake Bay.
The USGS also collects routine and storm water quality samples that provide critical information about the water quality as it exits the Susquehanna River watershed and enters the Chesapeake Bay. Water samples at the Conowingo site (01578310) are analyzed for nutrients such as nitrogen and phosphorus, suspended sediment, major ions, selected trace metals, and pesticides. Water quality data from Conowingo can be found at the USGS NWIS Water Quality webpage.
When precipitation falls in the Susquehanna River basin, it takes time for the water to run off of the land, collecting in small streams and creeks before moving downstream to join the main stem. As this stormwater flows it develops the brown and cloudy color of water enriched with nutrients and suspended-sediment. Compared to a routine sample in calm conditions, the turbulent stormwater can carry huge amounts of nutrients and sediment in a short time, it is critical to capture this water. Sample too early and you haven’t captured the stormwater, too late and you’ve missed it.
Big rain events that lead to high flows at the dam in excess of 200,000 cubic feet per second (cfs), or 1.5 million gallons a second, are especially important to sample: Such high flows carry with them significantly more nutrients and sediment than the river’s average flow, which is why it’s critical that we get the sample at the right time.
Fun Facts
The maximum discharge recorded at this site was 1,130,000 cfs on June 24, 1972 due to Hurricane Agnes. The minimum discharge was 144 cfs, recorded on Mar. 2, 1969.

Updates To Our Gage Network
In the last 3 months, we added one new gage and upgraded two gages. Our newest gage, St. Mary’s Lake Near Callaway, MD (01661499) measures gage height and has an accompanying rain gage (381510076320001). We also added water-quality capabilities to two of our St. Jones River gages, specifically measuring temperature and specific conductance at St. Jones River Near Magnolia, DE (01483750) and St. Jones River at Lebanon, DE (01483740).
Latest Publications
Get Our News
These items are in the RSS feed format (Really Simple Syndication) based on categories such as topics, locations, and more. You can install and RSS reader browser extension, software, or use a third-party service to receive immediate news updates depending on the feed that you have added. If you click the feed links below, they may look strange because they are simply XML code. An RSS reader can easily read this code and push out a notification to you when something new is posted to our site.