
1994 M6.7 Northridge, CA Shakemap
Detailed Description
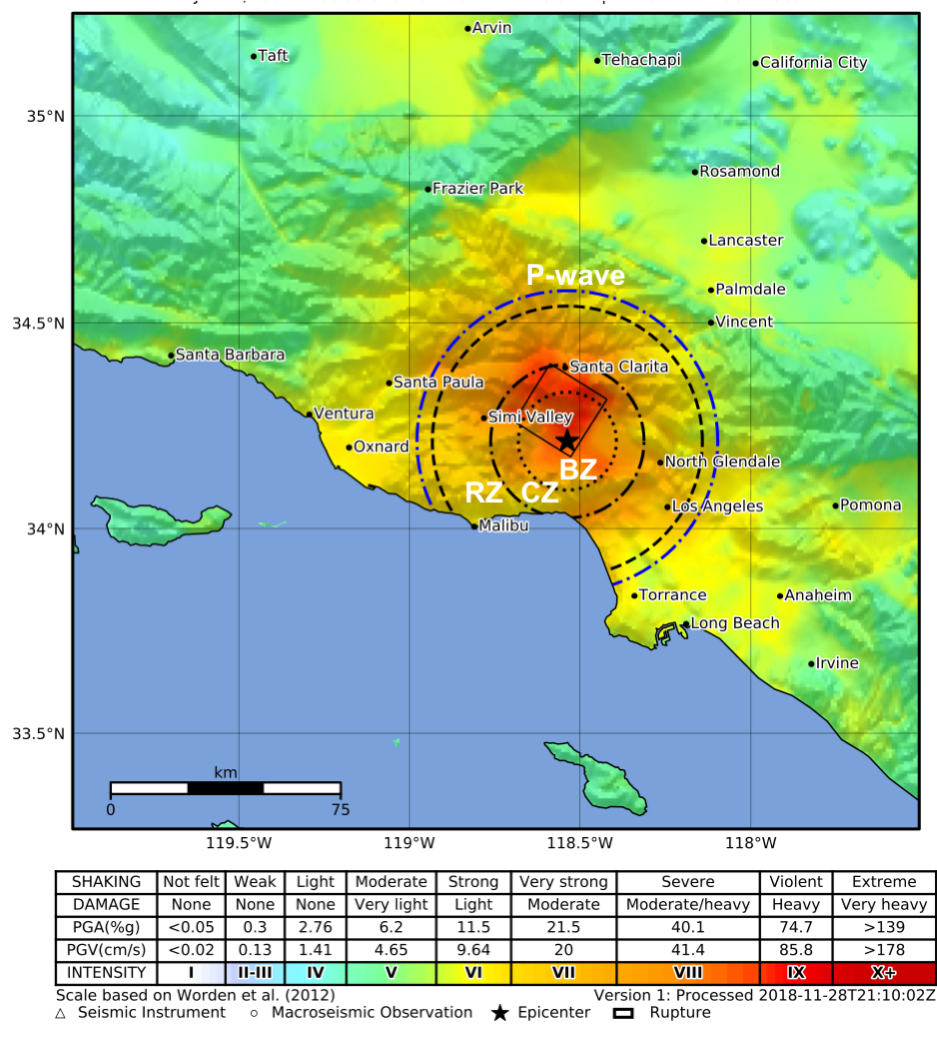
The 1994 M6.7 Northridge, CA Shakemap showing MMI (Modified Mercalli Intensity) levels of shaking, with the earthquake epicenter shown as a red star, and the fault shown as a rectangle. The innermost dotted circle doesn’t include the communication or reaction time latency (area labeled BZ); the next dash-dotted circle includes the 2-second communication latency (area labeled CZ), and the next dashed circle also includes the 5-second reaction time (labeled RZ). Most residents in the area of the strongest shaking (red area) did not receive any warning. The outermost blue dash-dotted circle shows the location of the P wave at the warning time, suggesting that most residents of the strongly shaken area would have been alerted by the P-wave itself before they received a warning from the EEW system.
Sources/Usage
Public Domain.