
Earthquake activity and ground uplift of the Yellowstone caldera
Detailed Description
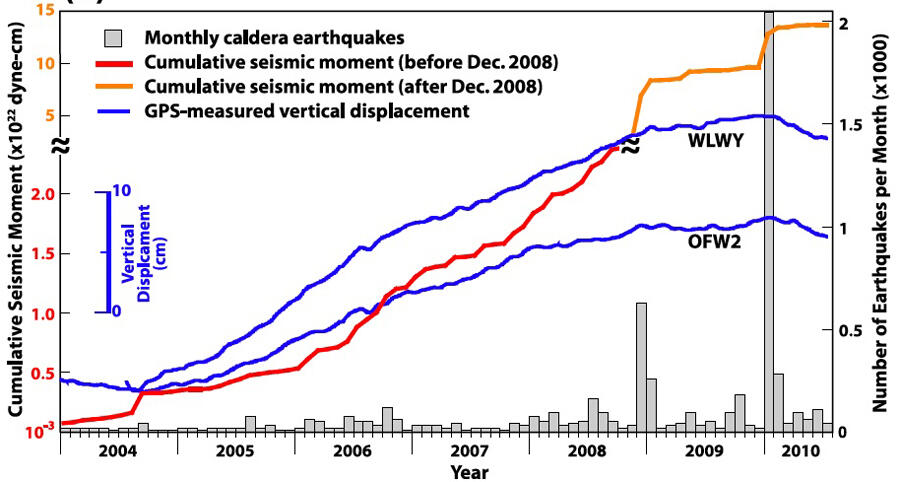
Comparison of earthquake activity and ground uplift of the Yellowstone caldera, 2003-2010. Uplift of GPS stations WLWY and OFW2 are shown as blue lines (compare with blue scale bar). The histogram (gray bars) shows the number of Yellowstone earthquakes per month (right Y axis), with most activity occurring during the period when the uplift began to slow.
Sources/Usage
Public Domain.