Figure 1. Plot depicting power to detect a trend of -4% per year over

Detailed Description
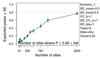
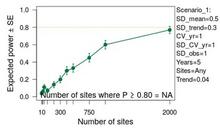
Figure 1. Plot depicting power to detect a trend of -4% per year over 5 years at various sample sizes.
Sources/Usage
Public Domain.

Official websites use .gov
A .gov website belongs to an official government organization in the United States.
Secure .gov websites use HTTPS
A lock () or https:// means you’ve safely connected to the .gov website. Share sensitive information only on official, secure websites.
Figure 1. Plot depicting power to detect a trend of -4% per year over 5 years at various sample sizes.
Public Domain.