
Figure 9. MODIS image showing D8WY13 dust event (left). Figure 10. MODIS image showing D8-WY13 dust event (right).
By Geosciences and Environmental Change Science Center
2009 (approx.)
Detailed Description
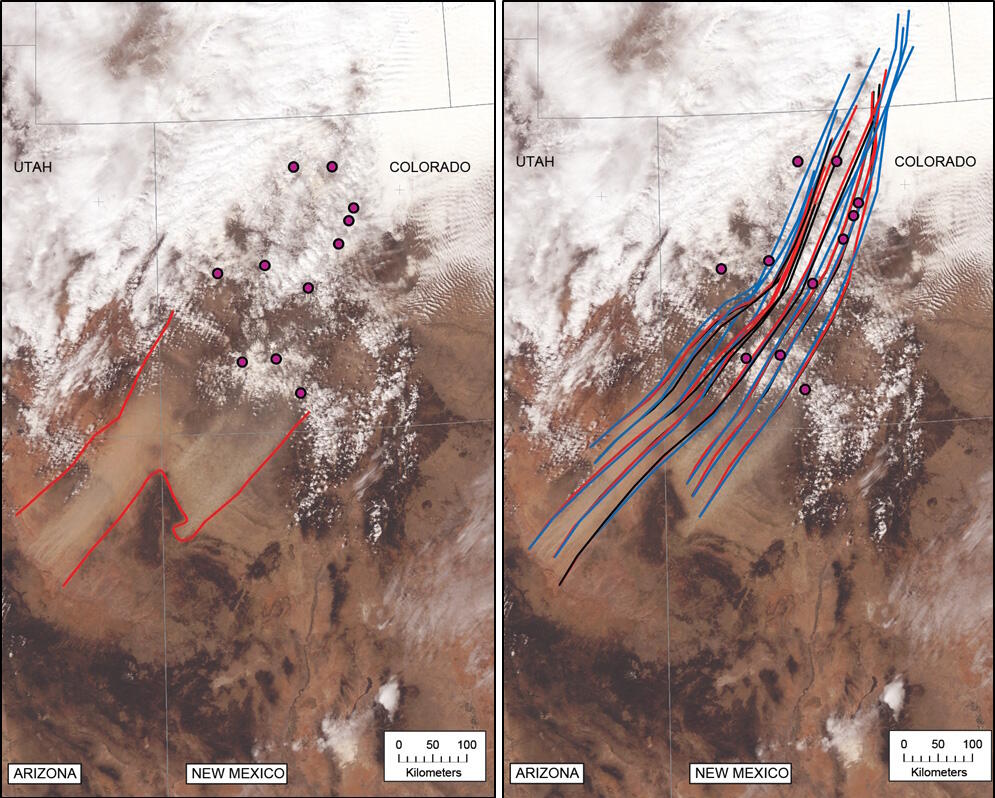
Figure 9. MODIS satellite image showing D8WY13 dust event originating in the Four Corners region. Red outline denotes extent of major dust emission visible on this image. Circles are CODOS sites (left).
Figure 10. MODIS satellite image as in Figure 2, showing D8-WY13 dust event. Colored lines represent particle trajectories modeled using HYSPLIT (https://www.arl.noaa.gov/HYSPLIT_info.php) at various altitudes for 12 hours. Black - 100 meters above ground level (MAGL); red - 200 MAGL; blue - 500 MAGL. Dust emitted in the Four Corners region during this event appears to have traveled northeast across the CODOS sites within a 12 hour period (right).
Sources/Usage
Public Domain.
Related Content

Sources, compositions, and effects of atmospheric dust from American Drylands
The Drylands Project undertakes studies to measure past and ongoing changes in dust sources, flux, and composition in the American West, and strives to understand the effects of atmospheric dust on pressing national and global issues of snowmelt acceleration, air quality, and human health. The project develops the capability to forecast future dust emission/deposition and effects on the basis of...
Related Content
Sources, compositions, and effects of atmospheric dust from American Drylands
The Drylands Project undertakes studies to measure past and ongoing changes in dust sources, flux, and composition in the American West, and strives to understand the effects of atmospheric dust on pressing national and global issues of snowmelt acceleration, air quality, and human health. The project develops the capability to forecast future dust emission/deposition and effects on the basis of...