
Flow cytometric dot plot

Detailed Description
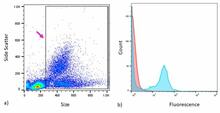
Figure 4. a) Flow cytometric dot plot showing isolated and gated (arrow) white blood cells (WBC) from an American kestrel hatchling after exposure to a flame retardant. Red blood cells at the origin are gated out of the analysis of the protein marker for T helper WBC. b) An analysis of the gated WBC stained for the CD4-fluorochrome marker indicating the presence of the immune cell type. Histogram overlays of the control isotype (red) and anti-CD4 fluorescence label (blue) allows for measuring the immune response by the cells analogous to chicken T helper cells.
Sources/Usage
Public Domain.