
GFSAD30 Figure 4

Detailed Description
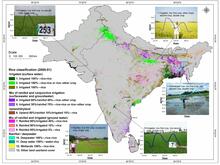
Rice map of South Asia. Crop phenologies and intensities studied using time-series remotely sensed data illustrated for rice crop in South Asia. A clear and deep understanding of phenologies and intensities will require us to develop a temporal (e.g., this figure) and spectral knowledge base of each crop in different agro-ecosystems of the world leading to mapping distinct classes within a crop, which in turn will lead to accurate assessments of green water use (rainfed croplands) and blue water use (irrigated croplands).
Sources/Usage
Courtesy: Dr. Prasad Thenkabail