
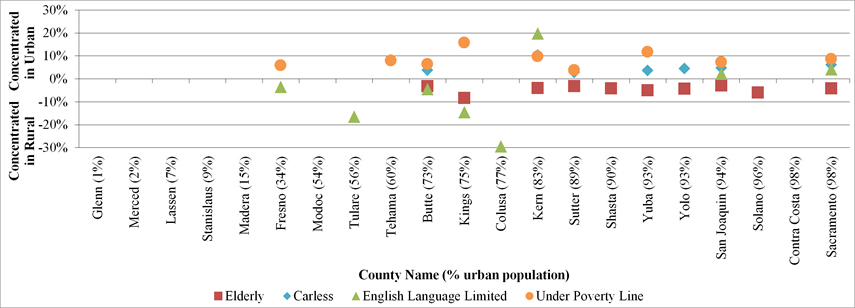
Graph of ARkStorm population exposure in rural and urban areas
By Western Geographic Science Center
2014 (approx.)

Detailed Description
Difference in population concentrations in and out of the ARkStorm flood zone. Note: counties ordered by percentage of the county population that is flooded, with only statistically significant difference in population proportions displayed.
Sources/Usage
Public Domain.