
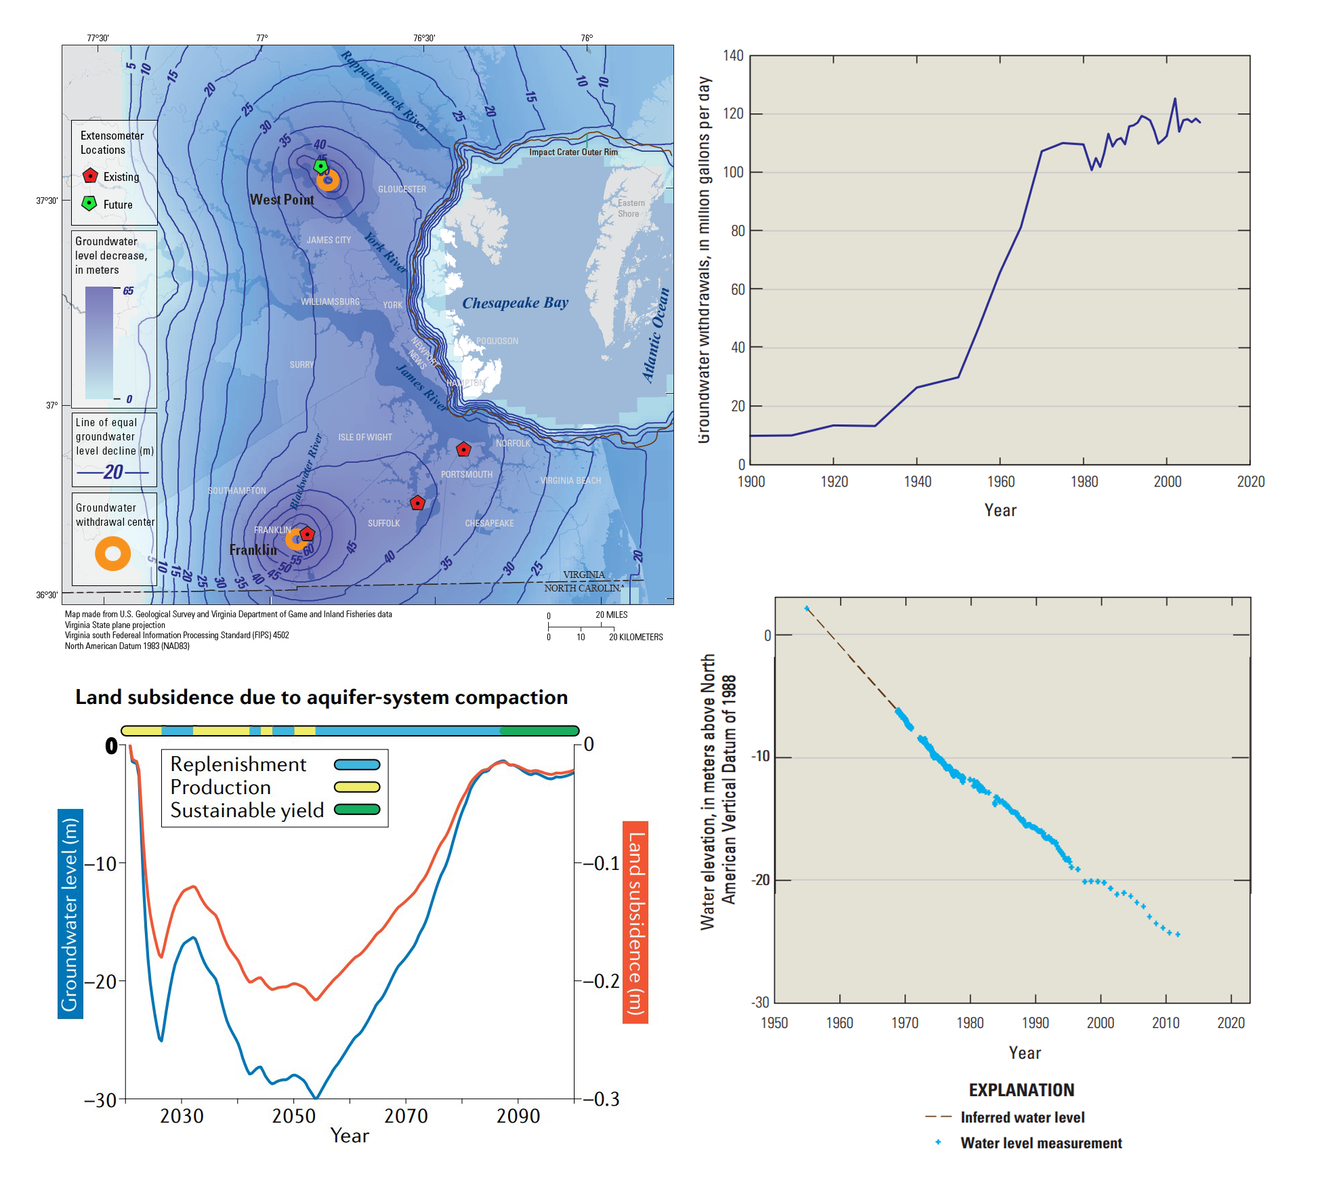
This static map shows the locations of the three existing extensometers (red) in the USGS' Virginia Extensometer Network with the location of a fourth future extensometer (green). The basemap is of the Virginia Coastal Plain and shows the severity of groundwater depletion, with darker blue indicating greater groundwater depletion.
Groundwater Level Change
Detailed Description
Top left: A map of the Virginia Coastal Plain showing the locations of USGS extensometers in relation to centers of groundwater drawdown.
Bottom left: Simulated aquifer model based on the Santa Ana Coastal Basin, California, where land subsidence due to possible variations of groundwater level throughout the twenty-first century is calculated.
Top right: Groundwater withdrawal rates from Virginia Coastal Plain aquifers from 1900 to 2008. Modified from Heywood and Pope (2009).
Bottom right: Water levels in the Potomac aquifer at U.S. Geological Survey (USGS) groundwater monitoring well 55H 1 (site 372428076561501) in New Kent County, Virginia.
Sources/Usage
Public Domain.
Bottom left figure from: Shirzaei, M., Freymueller, J., Törnqvist, T.E. et al., 2021, Measuring, modelling and projecting coastal land subsidence, Nature Reviews Earth & Environment, 2(1), https://doi.org/10.1038/s43017-020-00115-x
All other figures from: Eggleston, Jack, and Pope, Jason, 2013, Land subsidence and relative sea-level rise in the southern Chesapeake Bay region: U.S. Geological Survey Circular 1392, 30 p., https://dx.doi.org/10.3133/cir1392.
Related Content

Virginia Extensometer Network
This static map shows the locations of the three existing extensometers (red) in the USGS' Virginia Extensometer Network with the location of a fourth future extensometer (green). The basemap is of the Virginia Coastal Plain and shows the severity of groundwater depletion, with darker blue indicating greater groundwater depletion.
Related Content
Virginia Extensometer Network
This static map shows the locations of the three existing extensometers (red) in the USGS' Virginia Extensometer Network with the location of a fourth future extensometer (green). The basemap is of the Virginia Coastal Plain and shows the severity of groundwater depletion, with darker blue indicating greater groundwater depletion.
This static map shows the locations of the three existing extensometers (red) in the USGS' Virginia Extensometer Network with the location of a fourth future extensometer (green). The basemap is of the Virginia Coastal Plain and shows the severity of groundwater depletion, with darker blue indicating greater groundwater depletion.