
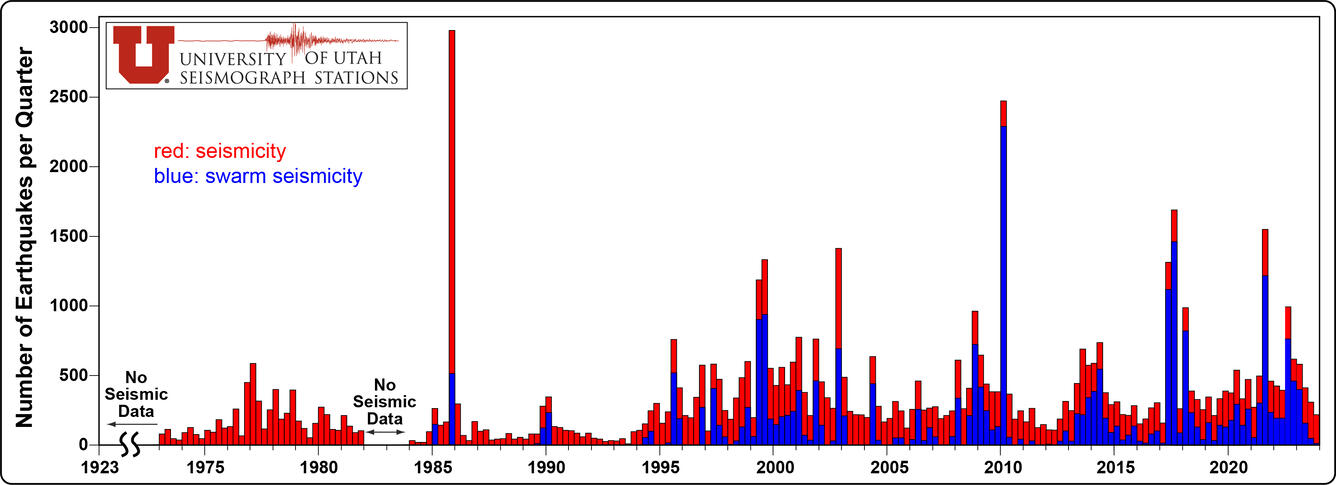
Histogram of Yellowstone earthquakes during 1973-2023
By Yellowstone Volcano Observatory
January 2024 (approx.)
Detailed Description
Histogram showing the number of earthquakes per 3-month period (quarter) in the Yellowstone region during 1973–2023. Red bars represent all earthquakes located in the area, and blue bars indicate swarm seismicity.
Sources/Usage
Public Domain.