
Hyperspectral Signatures

Detailed Description
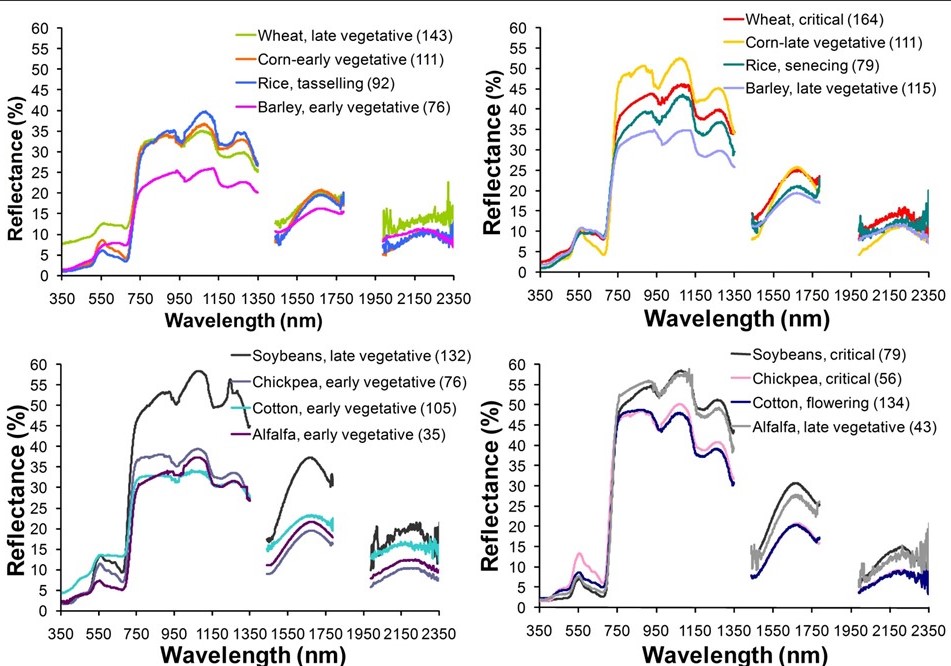
Figure 5: The hyperspectral data of some of the major world crops gathered from different places in the world are pooled based on their growing stages and plotted. The data are in 400-2500 nm range. Crops at distinct growth stages are characterized. Subtle changes in spectral reflectivity can be seen throughout the spectral range that indicate differences in biophysical and biochemical properties as well as structural and moisture properties of crops. Spectral plots are average values takes from a large sample size shown within the brackets of each spectrum in the legend. (Thenkabail et al. 2013)
Sources/Usage
Courtesy: Prasad Thenkabail
Thenkabail, P.S., Mariotto, I., Gumma, M.K.,, Middleton, E.M., Landis, and D.R., Huemmrich, F.K., 2013. Selection of hyperspectral narrowbands (HNBs) and composition of hyperspectral twoband vegetation indices (HVIs) for biophysical characterization and discrimination of crop types using field reflectance and Hyperion/EO-1 data. IEEE JOURNAL OF SELECTED TOPICS IN APPLIED EARTH OBSERVATIONS AND REMOTE SENSING, Pp. 427-439, VOL. 6, NO. 2, APRIL 2013.doi: 10.1109/JSTARS.2013.2252601. (80%). IP-037139.