
Magnetic-field variation
Detailed Description
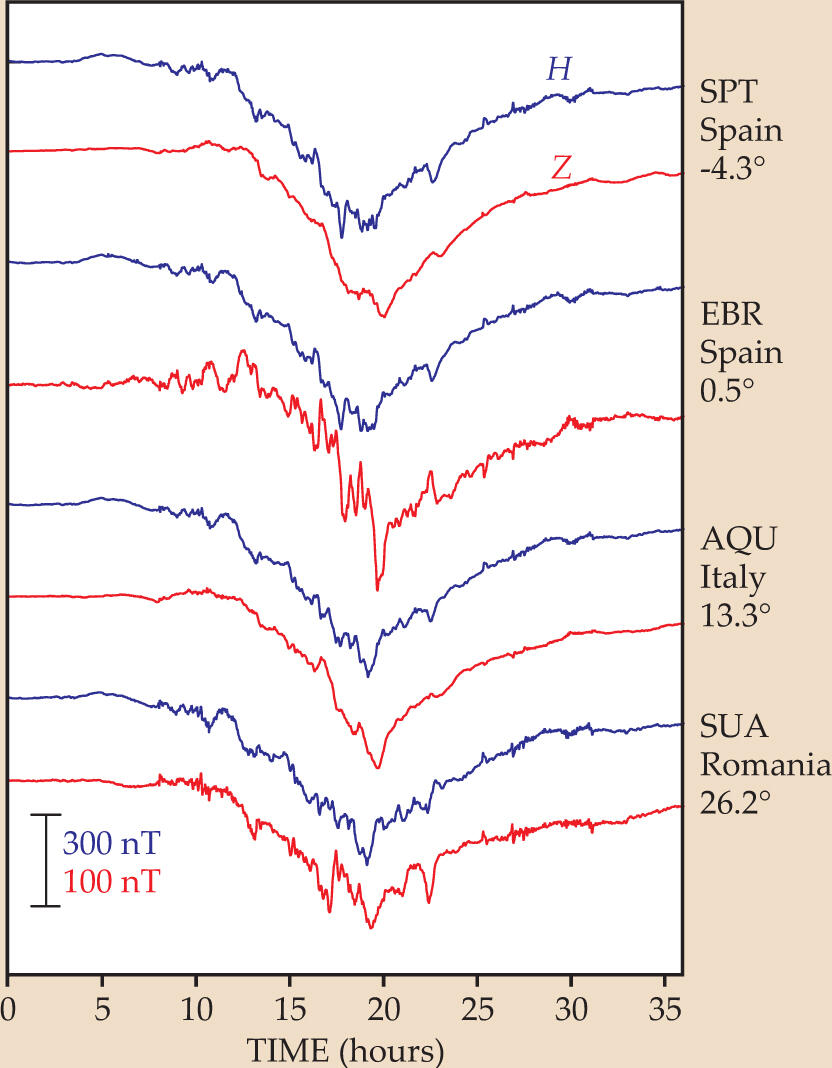
Figure 4. Magnetic-field variation reveals differences in subsurface electrical conductivity. Shown here are magne- tograms taken on 20–21 November 2003 at European ob- servatories of specified longitudes. Horizontal-intensity (H, blue) variation is driven by a storm in the magnetosphere. Site-to-site differences in the downward (Z, red) component are due to induced electric currents in the ocean and crust.
Sources/Usage
Public Domain.