
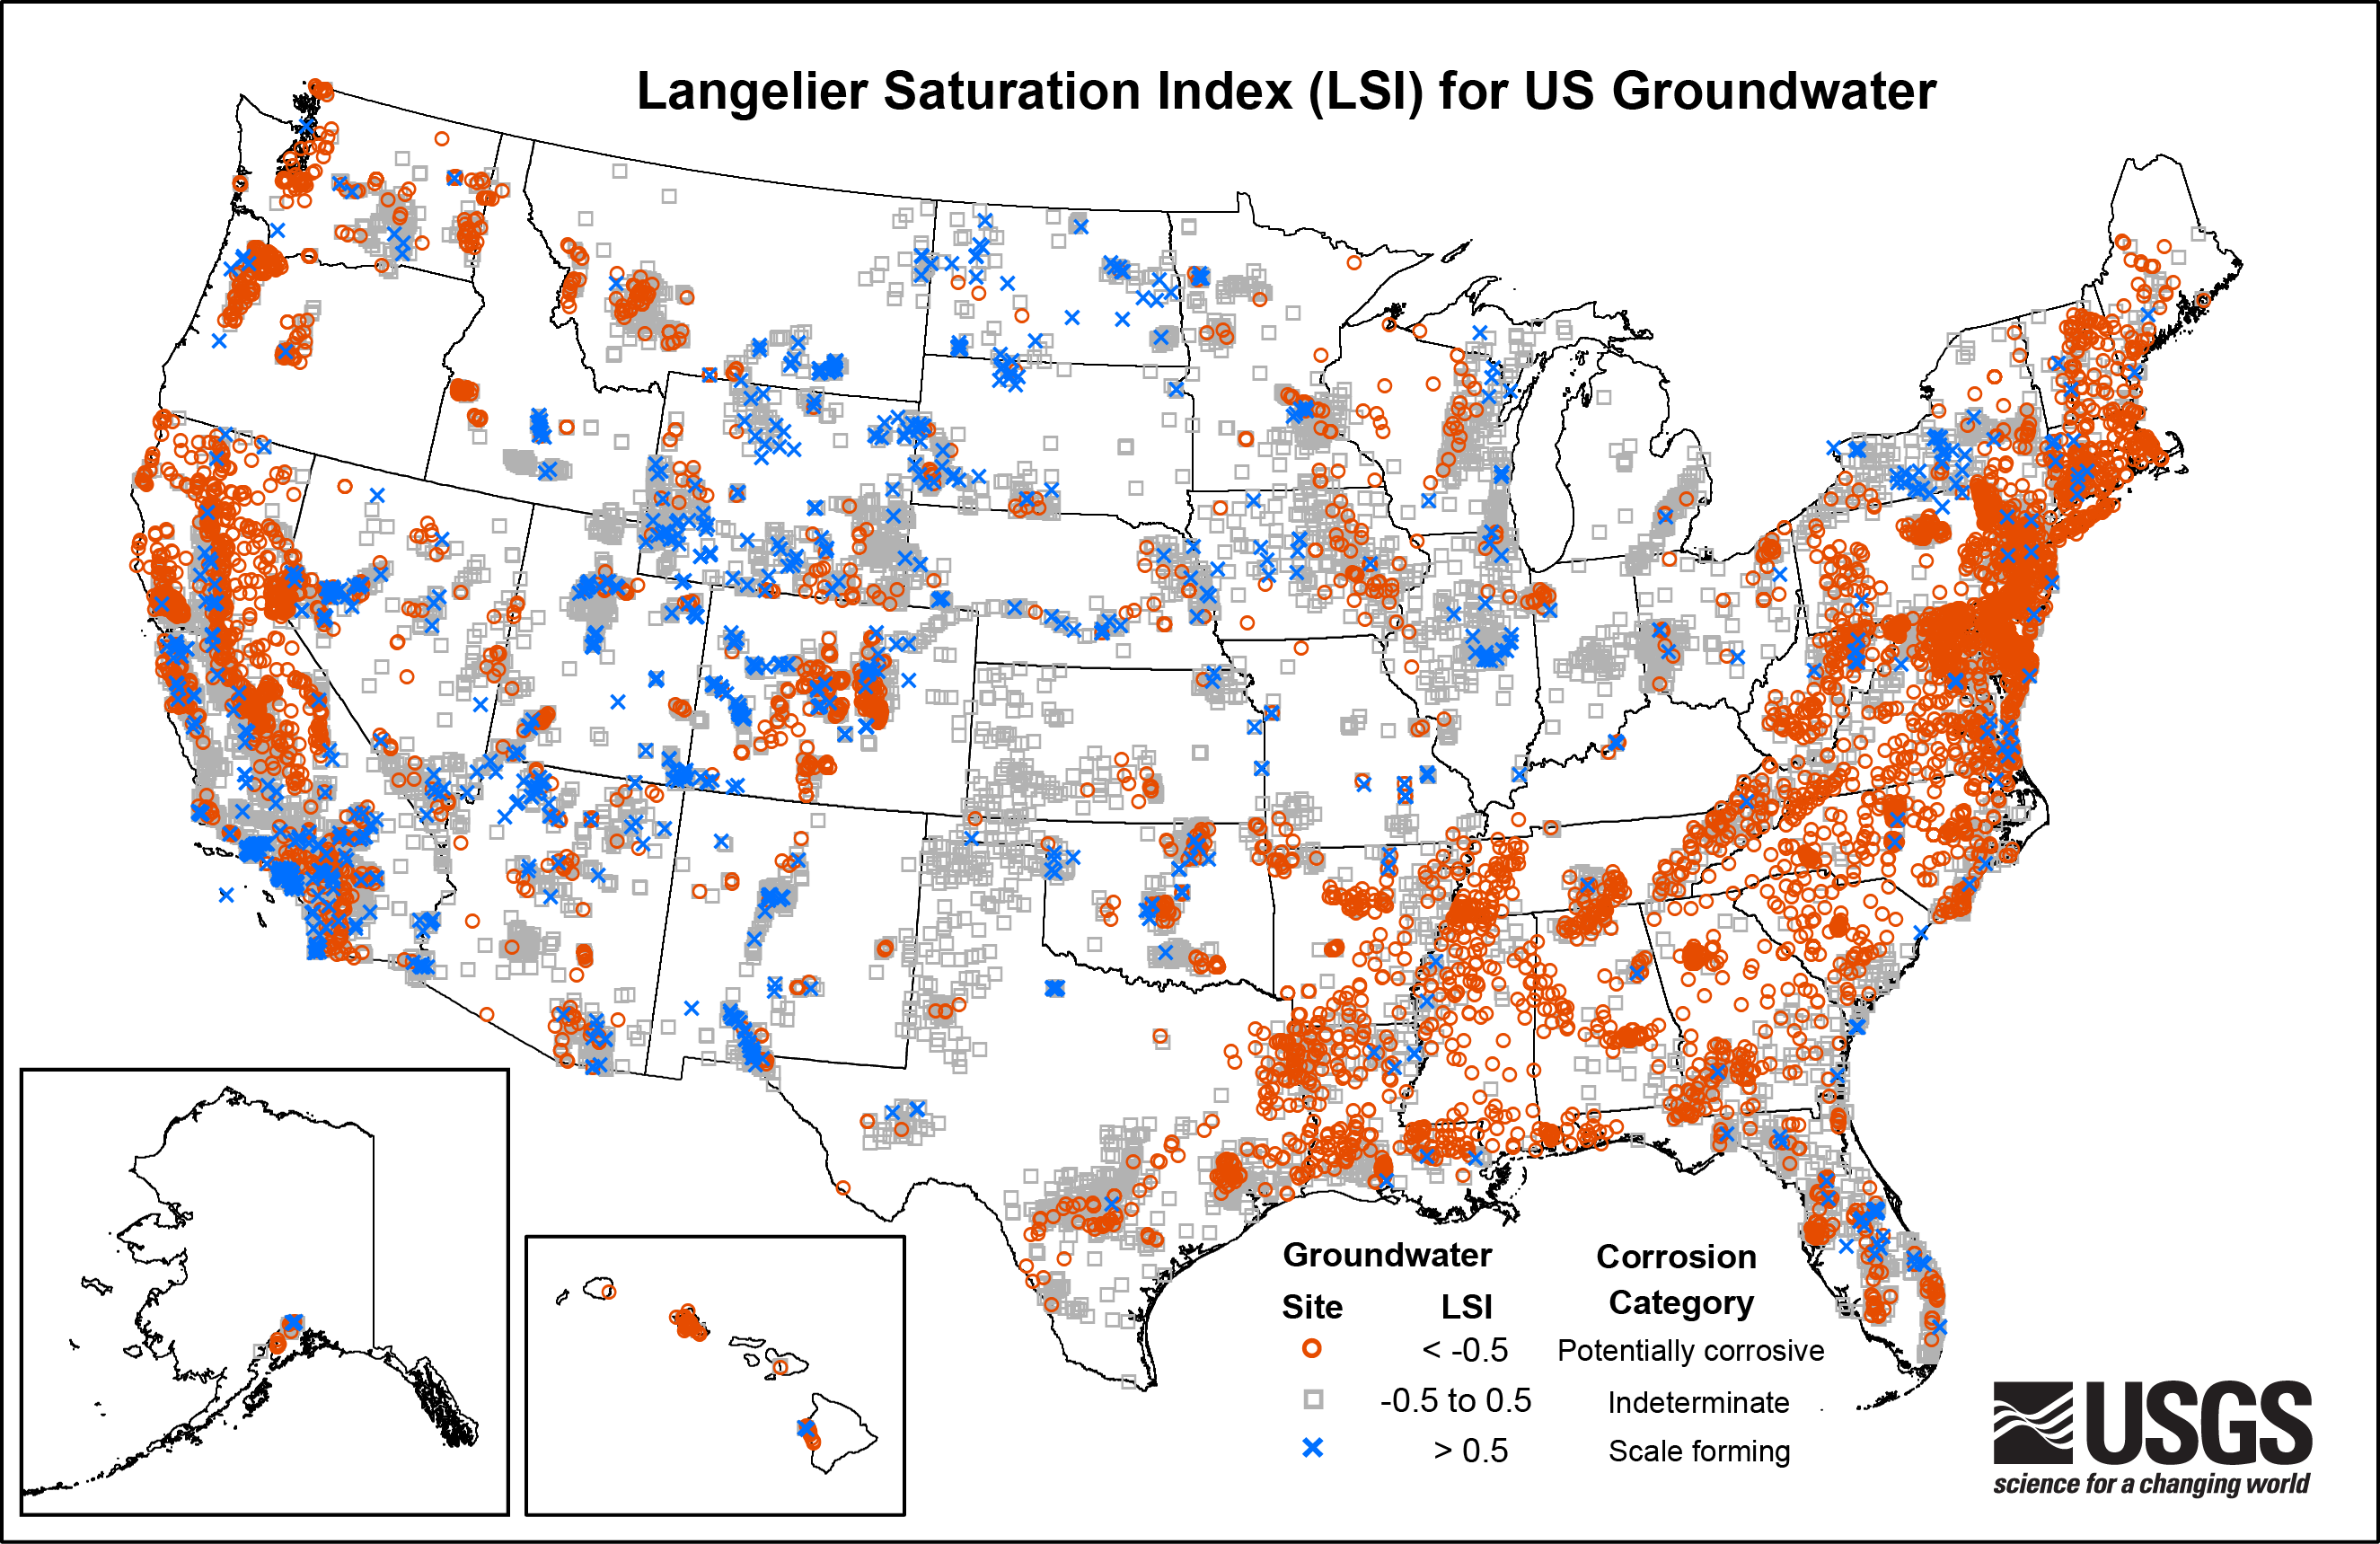
Map of Langolier Saturation Index Tested Groundwater Wells

Detailed Description
This map shows the Langelier Saturation Index for U.S. groundwater, one of the two indices combined for this study. It shows the degree of saturation of calcium carbonate in groundwater. If there is little calcium carbonate in the water, then it could be corrosive (shown in orange). If it is high in calcium carbonate (shown in blue), then it could deposit the excess calcium carbonate as scaling in pipes.