
Map shows where data were collected for the time-series datasets
Detailed Description
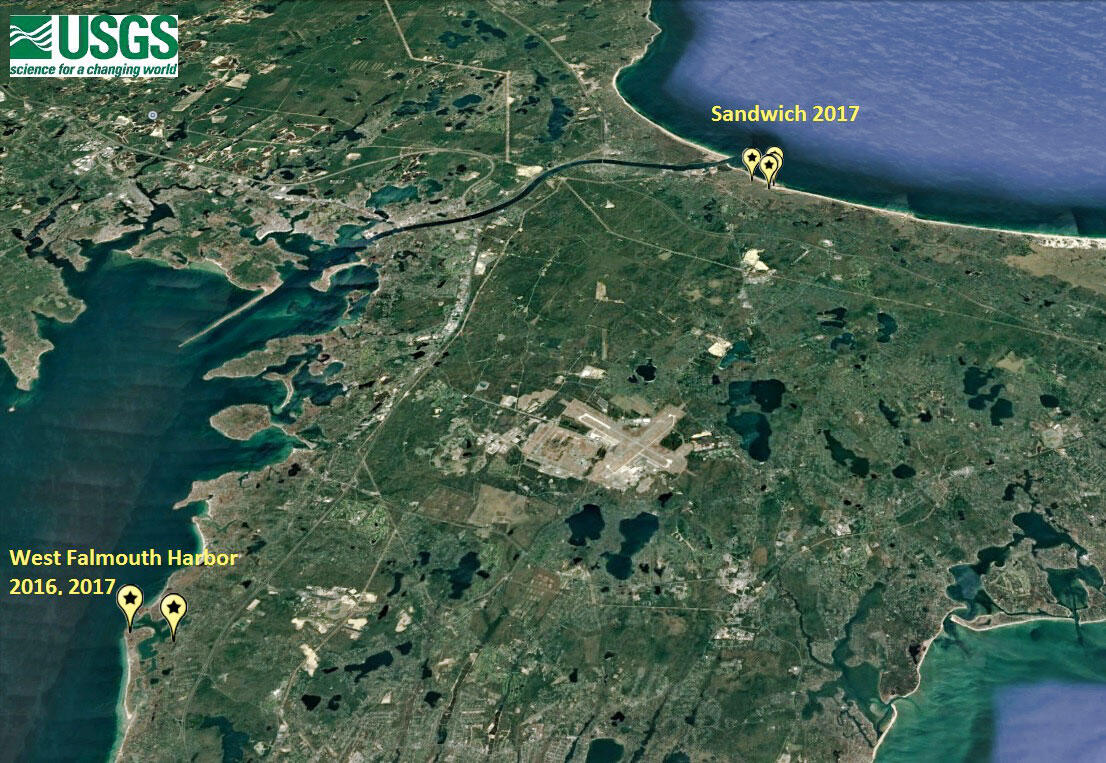
Map shows where data were collected for the oceanographic time-series datasets. Experiment names are in yellow text; individual sites are shown by place marks. Base map data from Google, 2017
Sources/Usage
Public Domain.