
Modeled climate and streamflow data for the Upper Colorado River Basin

Detailed Description
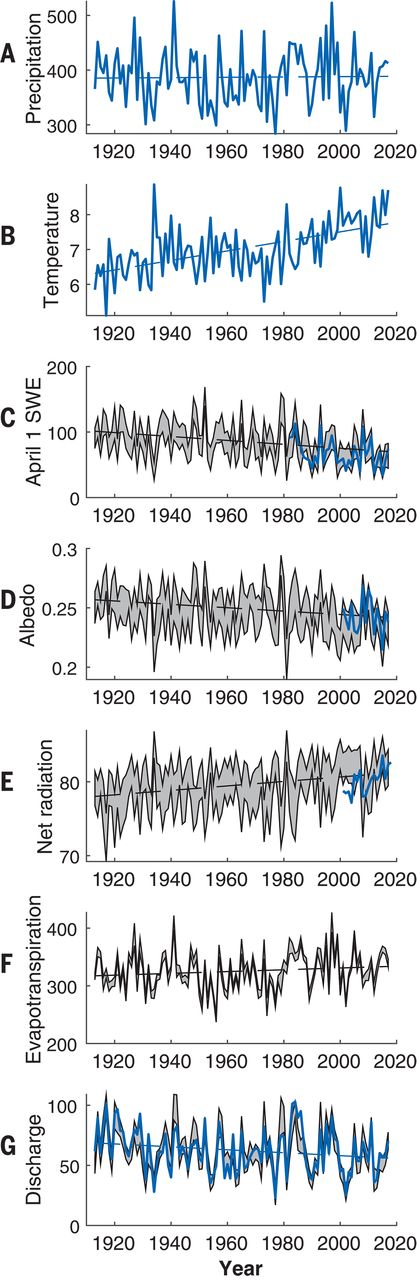
Graphs showing water-year time series of basin-mean, annual-mean (A) precipitation (millimeters per year), (B) temperature (degrees Celsius), (C) April 1 snow water equivalent (millimeters), (D) surface albedo, (E) surface net radiation (watts per square meter), (F) evapotranspiration (millimeters per year), and (G) discharge per unit area (millimeters per year). Blue curves represent estimates from observations, and grey bands represent ensemble range of model outputs. Black line represents least-squares linear fit.
Sources/Usage
Public Domain.