
Near Real Time Cheatgrass mapping
By Earth Resources Observation and Science (EROS) Center
2020 (approx.)
Detailed Description
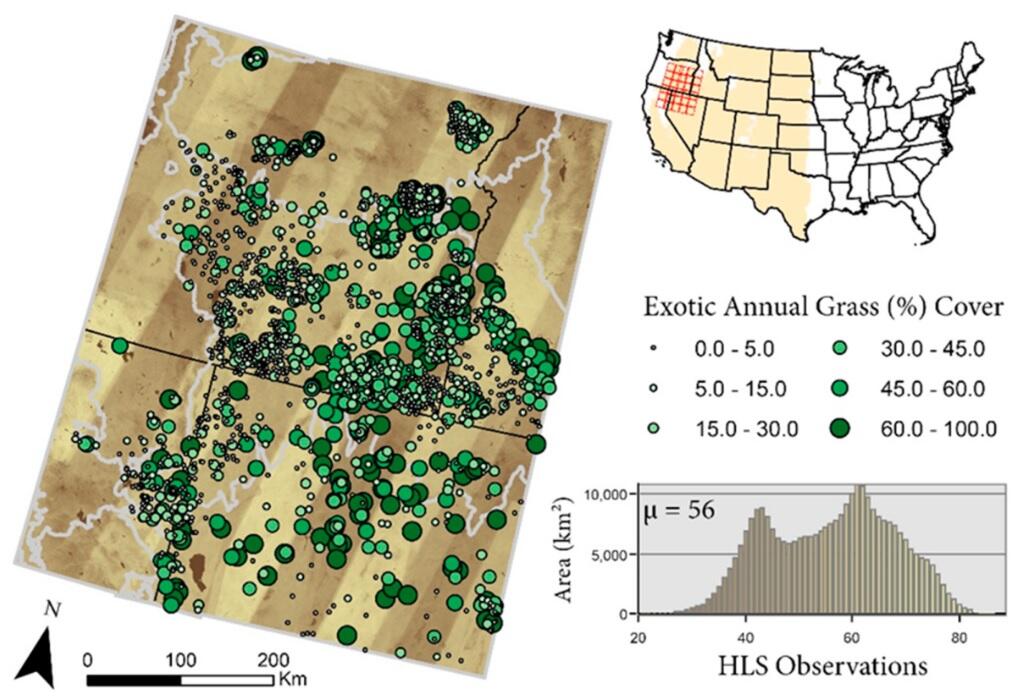
Number of valid harmonized Landsat and Sentinel-2 (HLS) observations from 2016 to 2018 overlaid by level III ecoregions and Bureau of Land Management Assessment, Inventory, and Monitoring (AIM) plots (2016–2017). Black lines indicate state boundaries and inset shows Sentinel-2 tiles and drylands in the United States. Drylands are defined by an aridity index [29], where the average ratio of annual precipitation to potential evapotranspiration (1970 to 2000) is between 0.03 and 0.5. From "Characterizing Land Surface Phenology and Exotic Annual Grasses in Dryland Ecosystems Using Landsat and Sentinel-2 Data in Harmony."
Sources/Usage
Public Domain.