
NOAA Multibeam Mapping Diagram

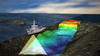
Detailed Description
An illustration from NOAA of how a ship like the R/V Falkor collects multibeam data. As the ship sails, multiple sound waves are sent out from the multibeam echosounder. These soundwaves then reflect off both the ocean floor and things in the water column, like bubbles from a methane seep. As the soundwaves reflect back to the ship, the multibeam echosounder receives the waves and interprets the data so that GIS specialists like Bill can create visualizations, not just of the ocean bottom, but of the entire 3-dimensional space beneath the ship.
Sources/Usage
Public Domain.