
“Noisy” InSAR interferogram examples covering the Island of Hawaiʻi

Detailed Description
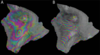
“Noisy” InSAR interferogram examples covering the Island of Hawaiʻi. (A) shows data that spans 12 days. This InSAR image show similar concentric ring patterns over both Mauna Loa and Mauna Kea. At first glance this might indicate deformation at both volcanos to the untrained eye, but the most likely reason for these colorful concentric ring patterns is atmospheric noise. (B) is another example of an InSAR interferogram with heavy atmospheric noise; this one has a 30-day difference from each SAR image. Some slight (less than a fraction of an inch/mm range) deformation on Mauna Loa and the Southeast Rift Zone of Kīlauea is visible in these images, yet still hard to discern from the atmospheric noise. Notice that the lower forested slopes of the island are blank. This is because heavy tree cover also causes errors in the interferograms. USGS images by Megan McLay, 9/7/2022.
Sources/Usage
Public Domain.