
Predicted relative amounts of baseflow normalized by drainage area
By New England Water Science Center
August 2021 (approx.)

Detailed Description
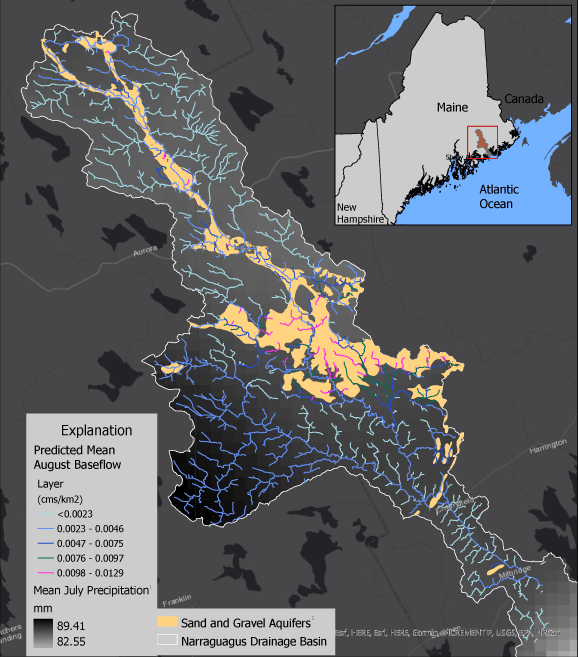
Map of the Narraguagus watershed in eastern coastal Maine showing predicted relative amounts of baseflow normalized by drainage area for each stream reach in the watershed. Values are given in cubic meter per second of baseflow per square kilometer of drainage area (cms/km2). Stream segments over the sand and gravel aquifer in the central portion of the watershed show the highest amounts of estimated mean August baseflow (Lombard and others, 2021).