
San Pablo Bay graphics
Detailed Description
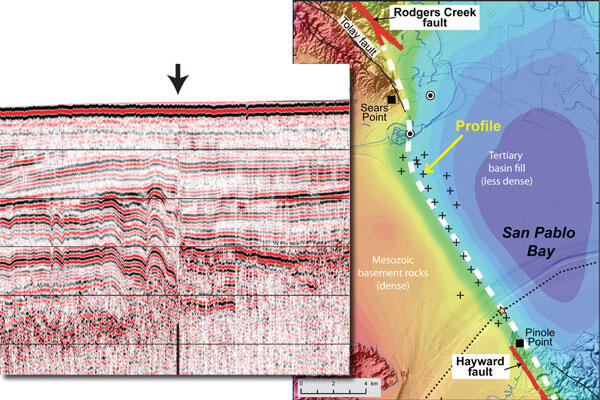
Above, left: Seismic-reflection profile created by bouncing sound waves off sediment layers beneath San Pablo Bay. Note deformation of layers by Hayward fault (black arrow). Above, right: Variations in gravity caused by differences in rock density under the bay. Sharp change in gravity values (dashed white line) lies close to sites where seismic-reflection profiles imaged the Hayward fault (plus signs).
Sources/Usage
Public Domain.