
SBDR Dashboard by Science Center
Detailed Description
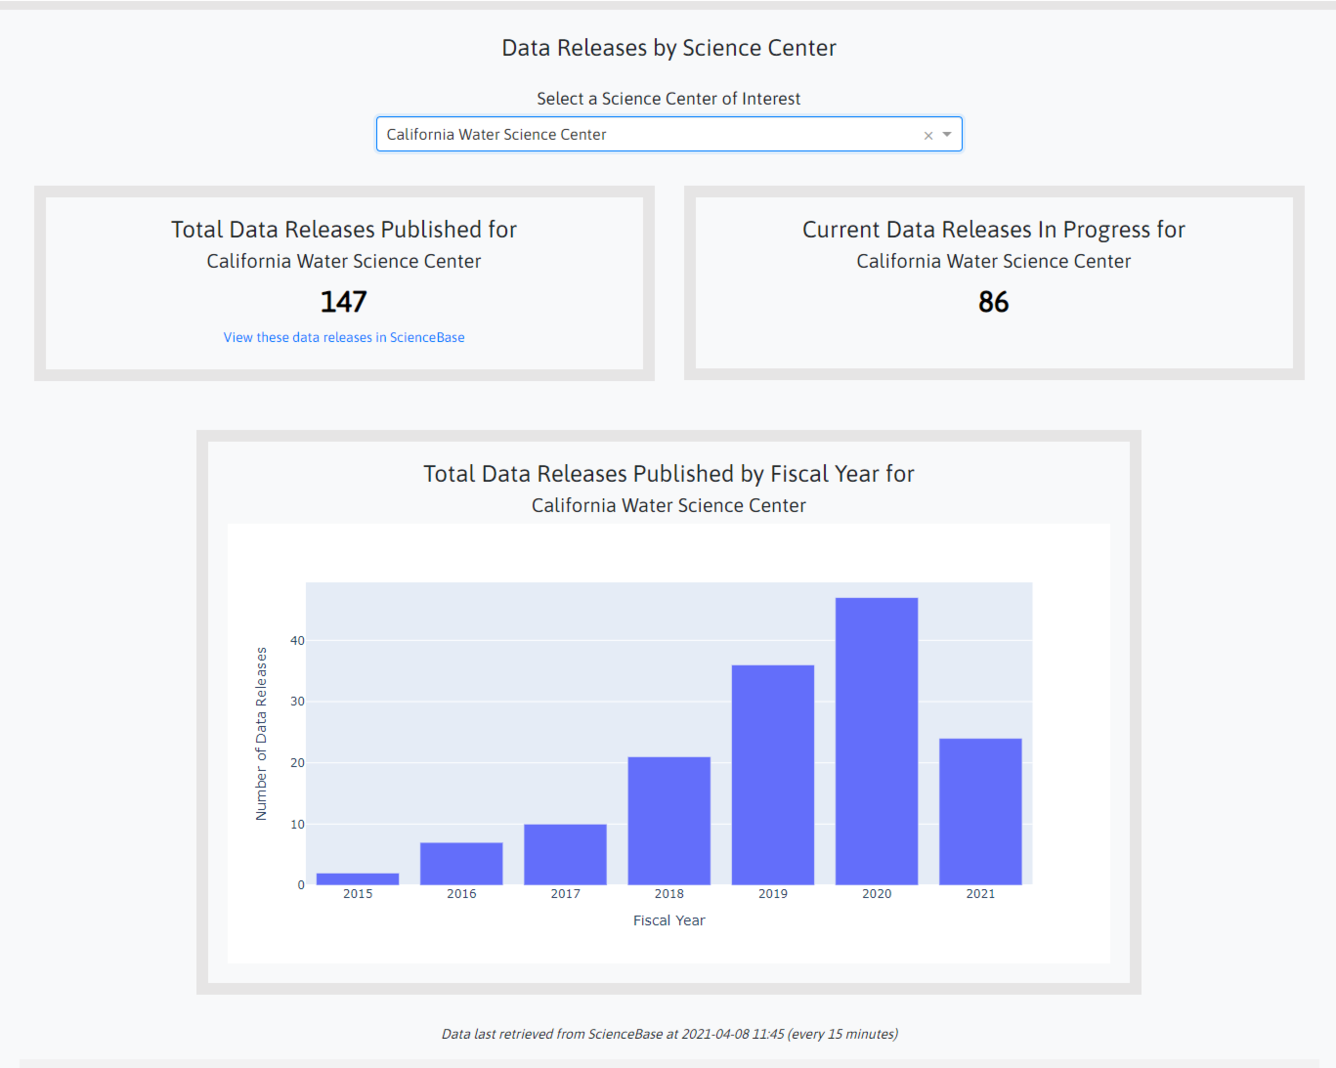
Screenshot of the SBDR Dashboard, depicting two boxes showing the total data releases published and in progress for California Water Science Center, and a bar graph of total data releases published by fiscal year for the same center, from 2015-2021. The number of data releases published trends upward each year until 2021.
Sources/Usage
Public Domain.