
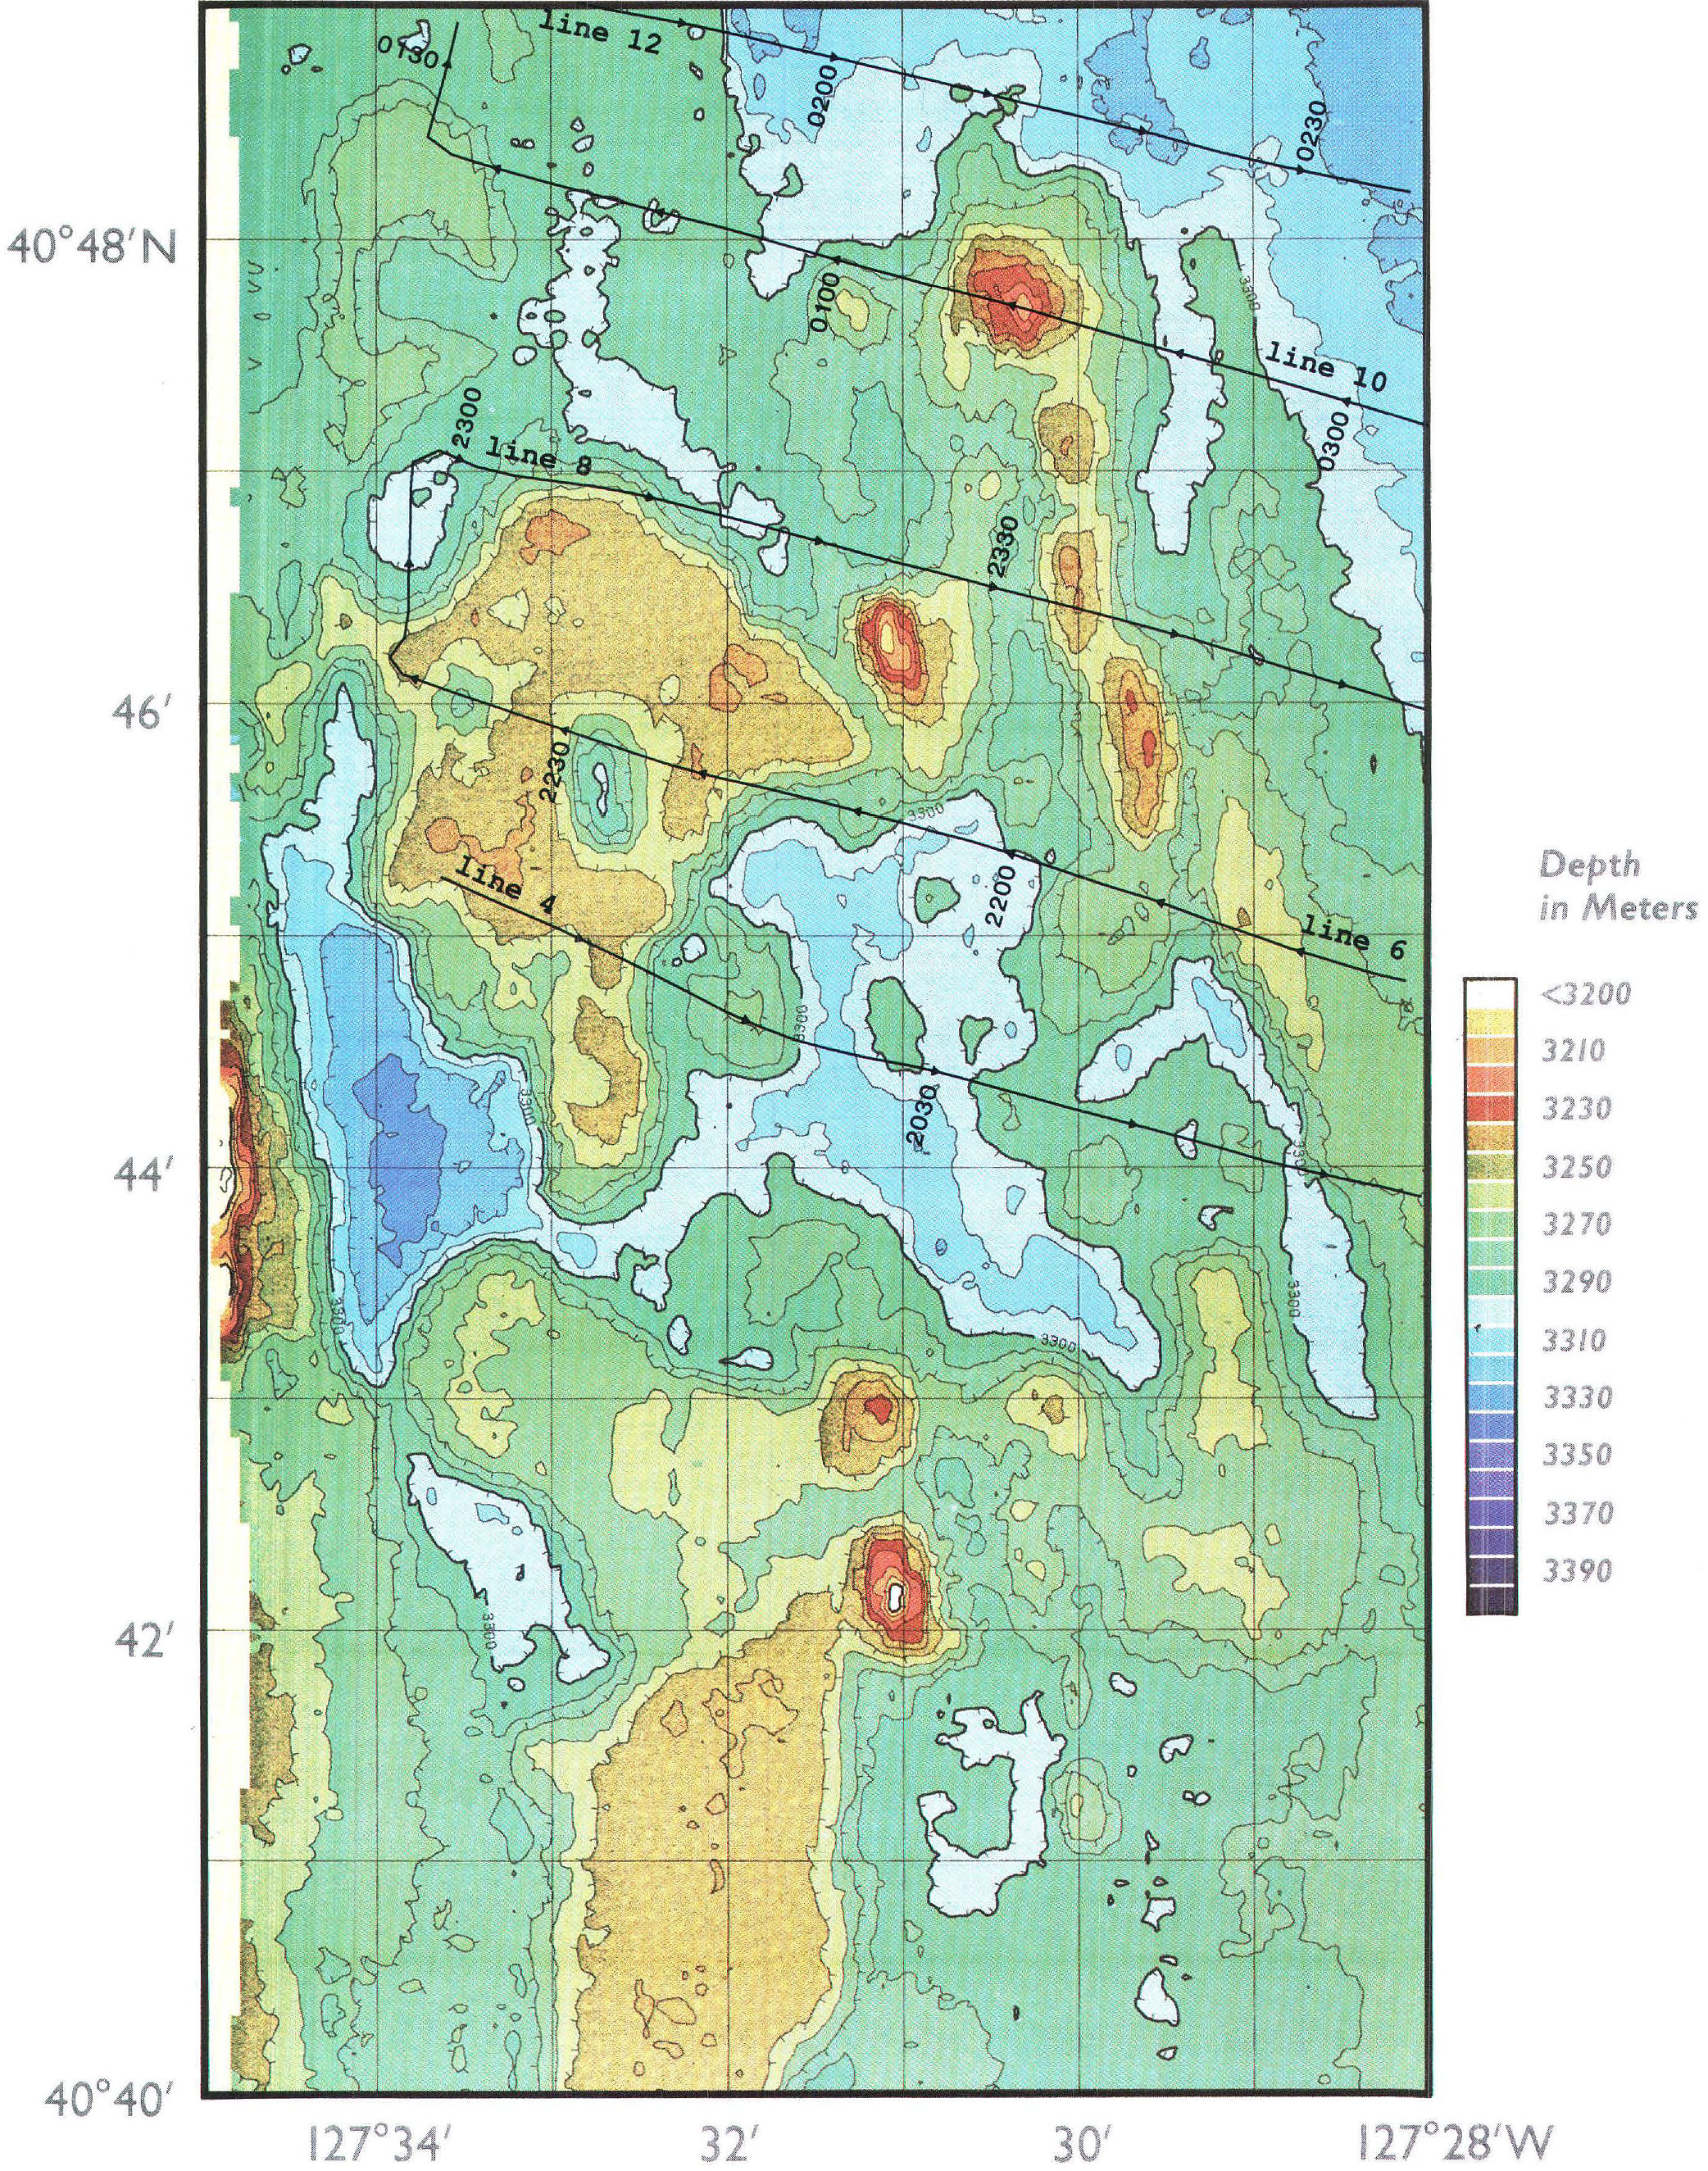
Sea Beam bathymetric map of the southern Escanaba Trough area
By Pacific Coastal and Marine Science Center
1986 (approx.)

Detailed Description
Sea Beam bathymetric map of southern Escanaba Trough study area. Contour interval is 10m and is noted by color change. Locations of single- channel water-gun reflection profiles 4 to 12, cruise L1-86-NC, are shown. Numbers along tracklines represent time of day corresponding to annotations at top of seismic reflection profiles in figure 2.12. Hachures indicate area of closed low. Map area is approximately 10 km wide.
Sources/Usage
Public Domain.