
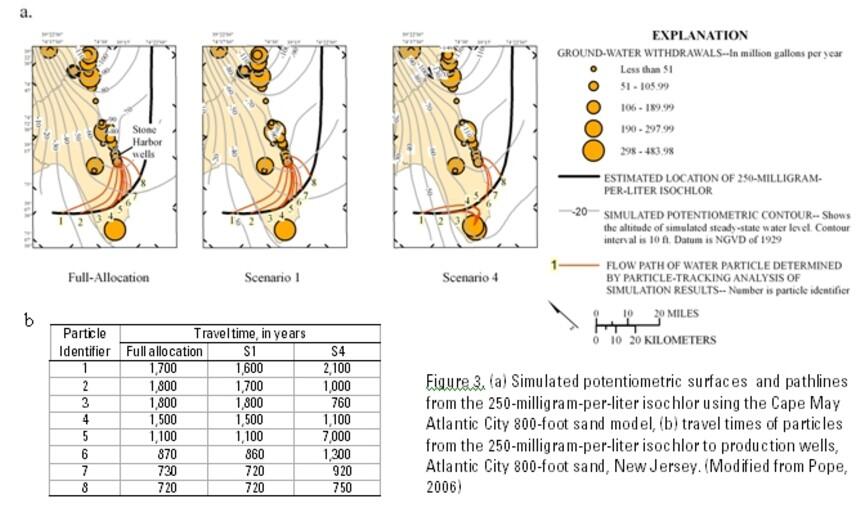
Simulated potentiometric surfaces and pathlines
By New Jersey
Detailed Description
Figure 3.—Simulated potentiometric surfaces and pathlines from the 250-mg/L isochlor using the Cape May Atlantic City 800-foot sand model, (b) travel time of particles from the 250-milligram-per-liter isochlor to production wells, Atlantic City 800-foot sand, New Jersey.