
STARFM and Landsat ARD comparison
By Earth Resources Observation and Science (EROS) Center
2017 (approx.)

Detailed Description
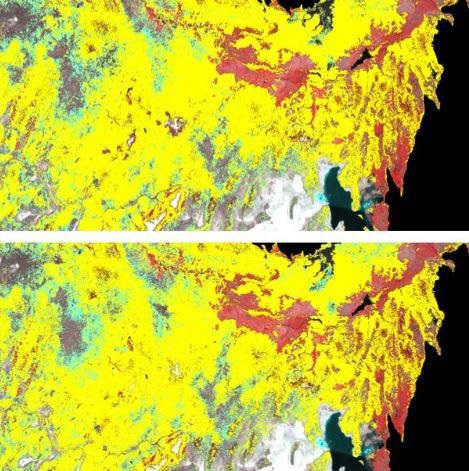
This graphic shows shrub and grass in a portion of the Great Basin at risk for fire, based on eight Landsat Analysis Ready Data (ARD) tiles using May 2017 data. Yellow represents high risk; aqua is medium risk. The top image is based on STARFM. The bottom is based on Landsat ARD composite data.
Sources/Usage
Public Domain.