
Surface wave test site plots
Detailed Description
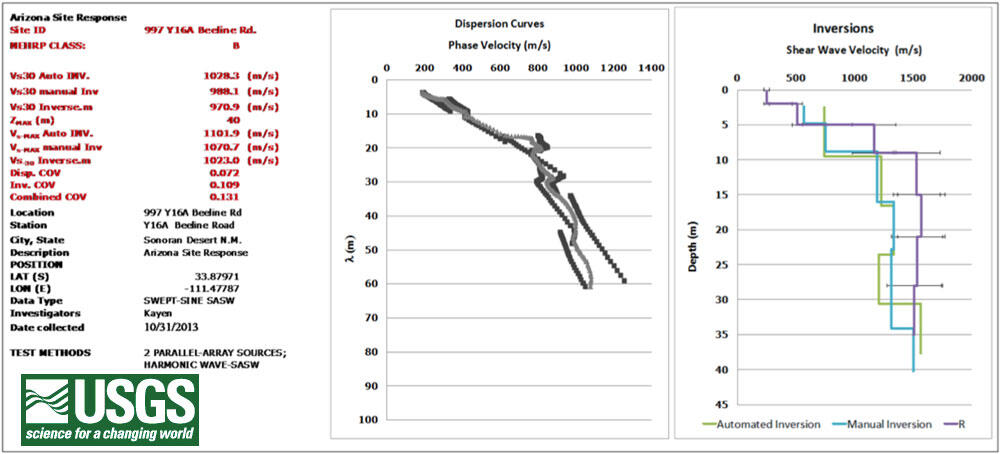
Site ID, location, and average shear wave velocity (left) for surface wave test site 997-Y16A; average dispersion curve in gray, and individual empirical dispersion curves in black (center plot); shear wave velocity profile computed by three inversion methods (right plot).
Sources/Usage
Public Domain.
Seismic Velocity Site Characterization of 10 AZ Strong-Motion Recording Stations by Spectral Analysis of Surface Wave Dispersion
USGS Open-File Report 2016-1208 by Robert E. Kayen, Brad A. Carkin, and Skye C. Corbett