
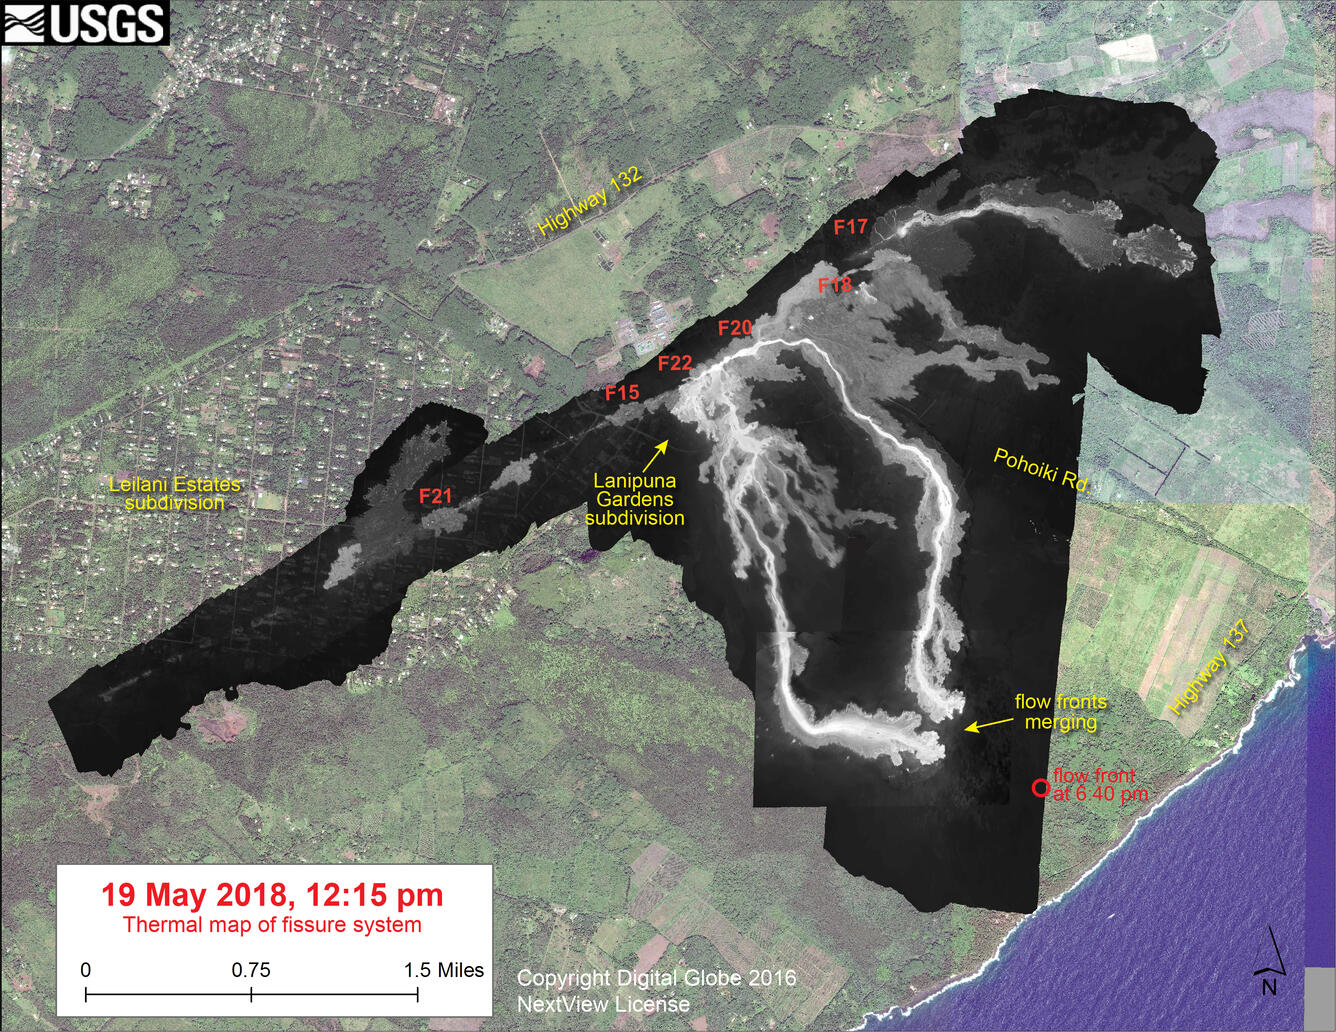
Thermal map of fissure system and lava flows
Detailed Description
This thermal map shows the fissure system and lava flows as of 12:15 pm on Saturday, May 19. The two primary lava flows originate from the Fissure 20-22 area, and crossed Pohoiki Road over the past day. The flow front position based on a 6:40 pm update is shown by the red circle. The black and white area is the extent of the thermal map. Temperature in the thermal image is displayed as gray-scale values, with the brightest pixels indicating the hottest areas. The thermal map was constructed by stitching many overlapping oblique thermal images collected by a handheld thermal camera during a helicopter overflight of the flow field. The base is a copyrighted color satellite image (used with permission) provided by Digital Globe.