
U.S. Groundwater Conditions Data Visualization Thumbnail Image

Detailed Description
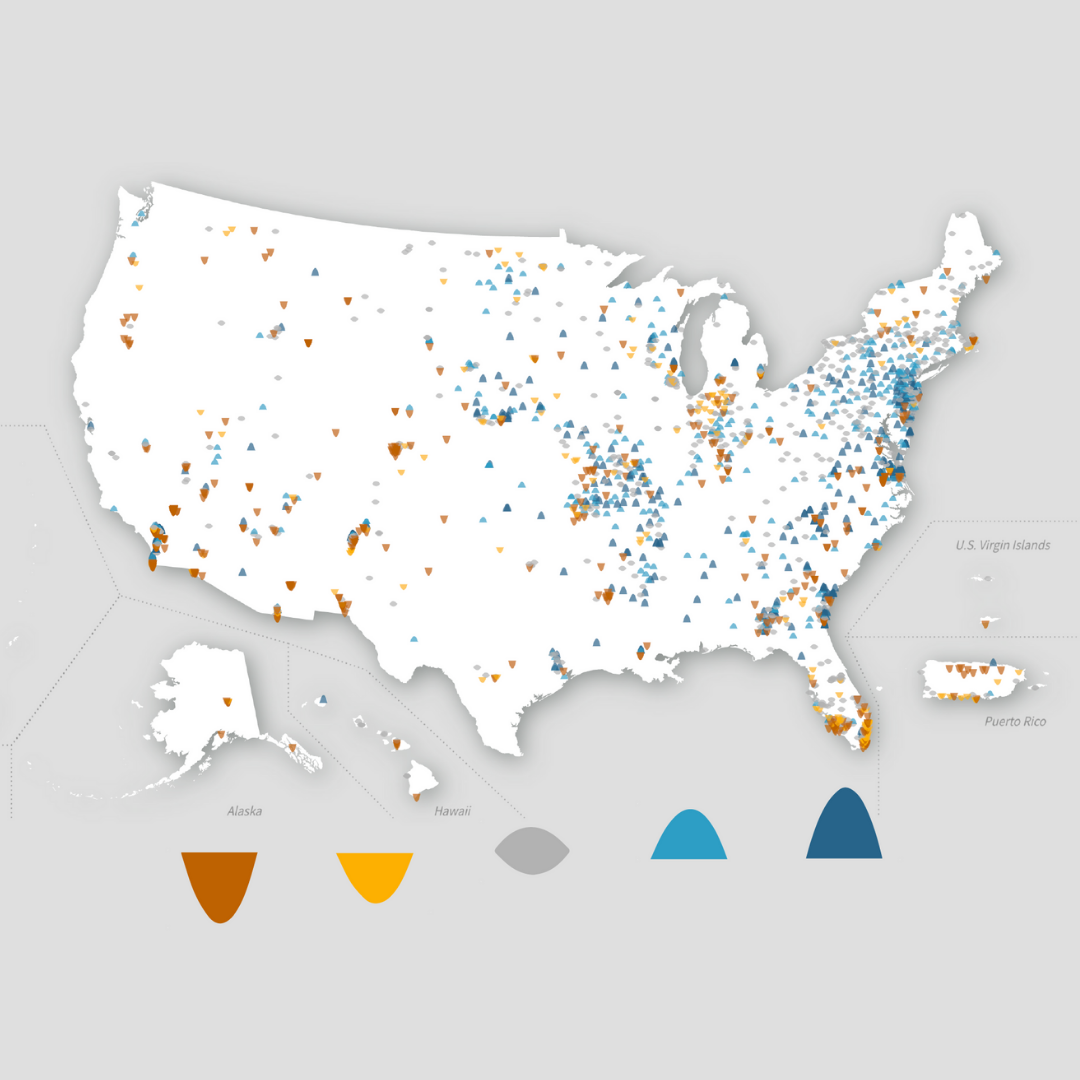
This is a still image representing an animated data visualization. The full data visualization animates groundwater levels at 2281 well sites across the U.S. At each site, groundwater levels are shown relative to the historic record (using percentiles), indicating where groundwater is comparatively high or low to what has been observed in the past. The corresponding time series chart shows the percent of sites in each water-level category through time.
To view the full animated data visualization go to: https://labs.waterdata.usgs.gov/visualizations/gw-conditions/index.html#/?utm_source=drupal&utm_medium=home&utm_campaign=gw_conditions
To learn more about groundwater monitoring efforts by the USGS and partners go to: usgs.gov/gwsip
Sources/Usage
Public Domain.