
Visualization of an ensemble of solutions for PEST++

Detailed Description
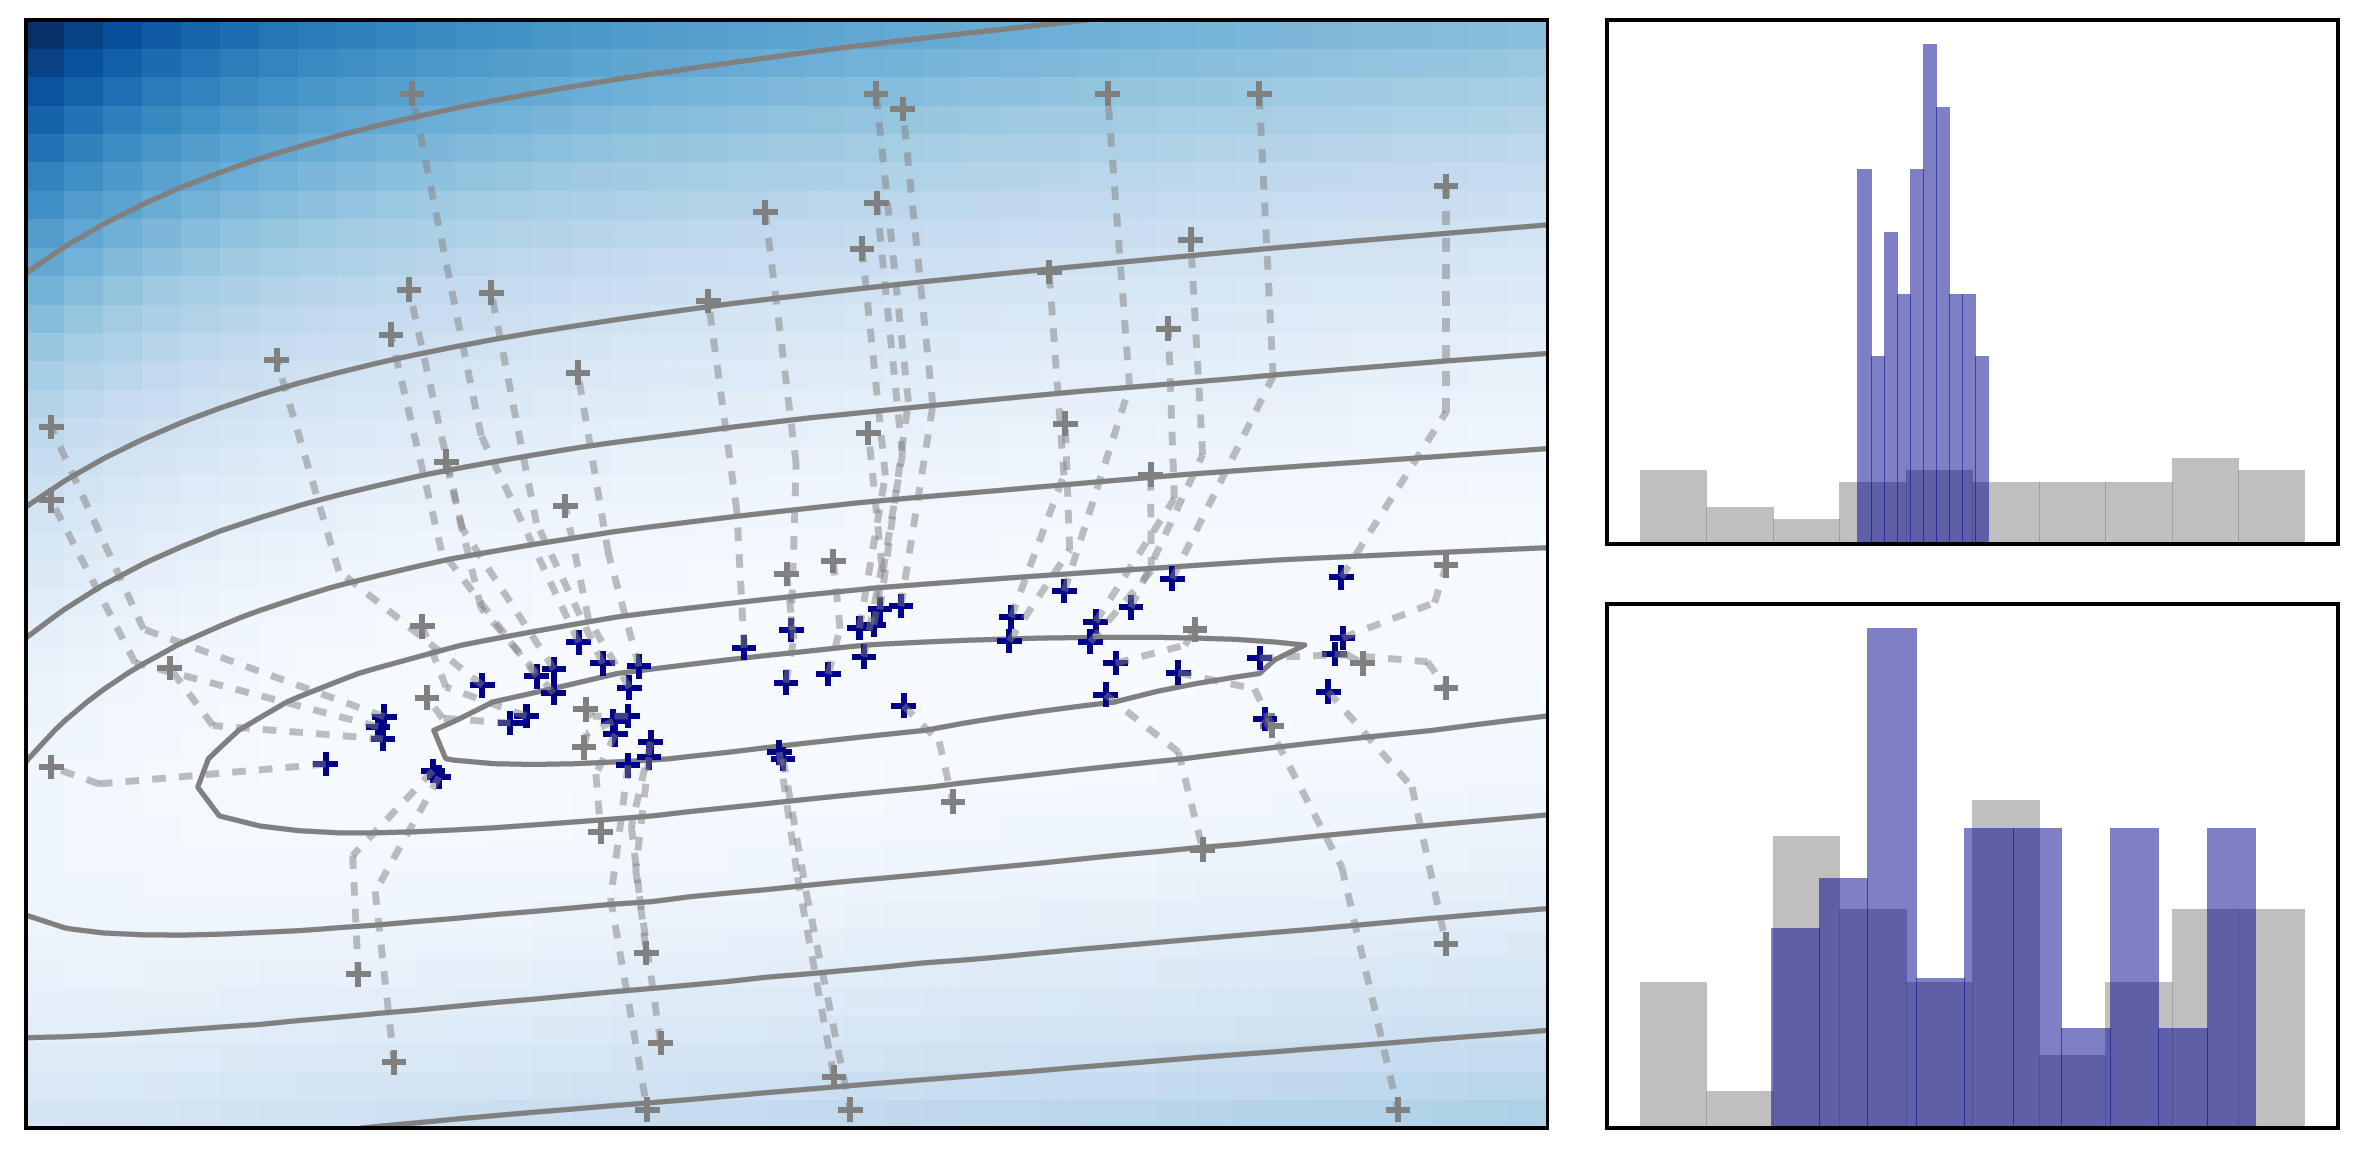
The left axis is a visualization of an ensemble of solutions (crosses and dashed lines) iteratively moving down gradient on an objective function surface (color flood) in 2-D parameters space, with the associated prior (gray) and posterior (blue) parameter marginal distributions shown on the two right stacked axes.
Sources/Usage
Public Domain.