Citation
U.S. Geological Survey (USGS), 2024, Annual NLCD Collection 1 Science Products: U.S. Geological Survey data release, https://doi.org/10.5066/P94UXNTS
References
Fleckenstein, R., Wellington, D.F., Jin, S., Tollerud, H.J., Brown, J.F., Dewitz, J.A., Pastick, N.J., Barber, C.P., O’Brien, A., and Spanier, M., 2026, A framework for integrating spatiotemporal deep learning methods with Landsat for annual land cover and impervious surface mapping: Remote Sensing of Environment, v. 338, article 115347, at https://doi.org/10.1016/j.rse.2026.115347.
Jin, S., Robinson, T., Dewitz, J.A., Smith, K., Danielson, P., and Postma, K., 2025, An automated compositing method for producing annual clear images from Landsat Collection 2 for annual NLCD production: International Journal of Applied Earth Observation and Geoinformation, v. 144, article 104920, at https://doi.org/10.1016/j.jag.2025.104920.
U.S. Geological Survey, 2025, Annual National Land Cover Database (NLCD) Collection 1.0 Reference Data Product: U.S. Geological Survey data release, https://doi.org/10.5066/P13EDMAF.

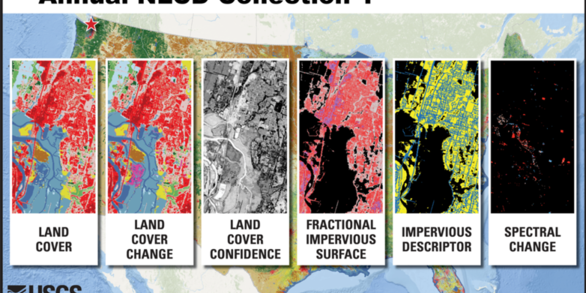


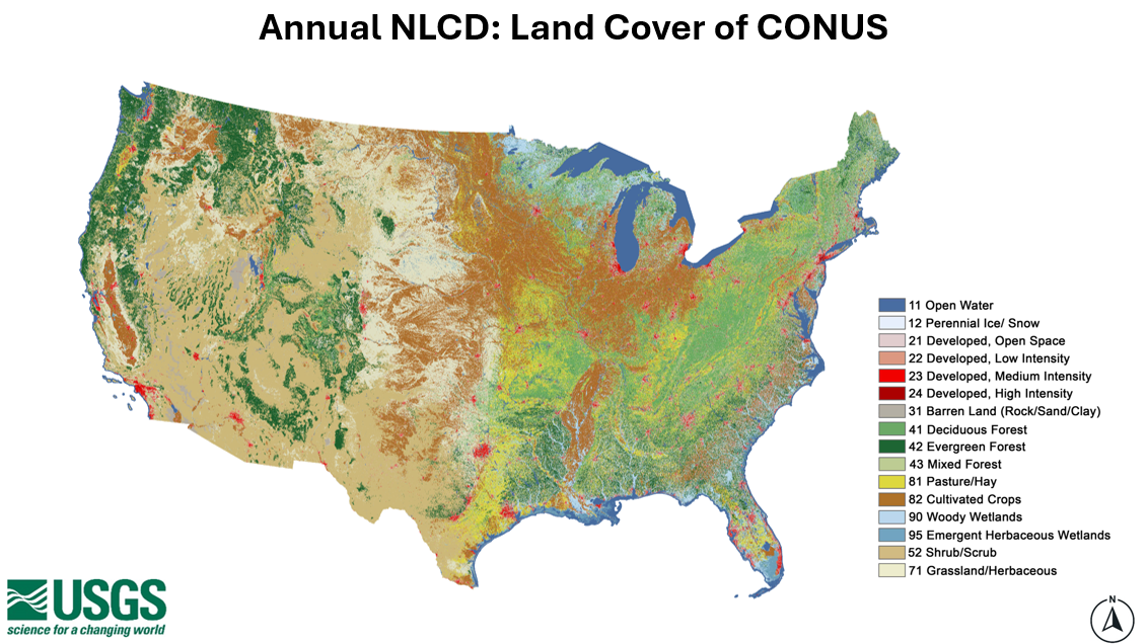


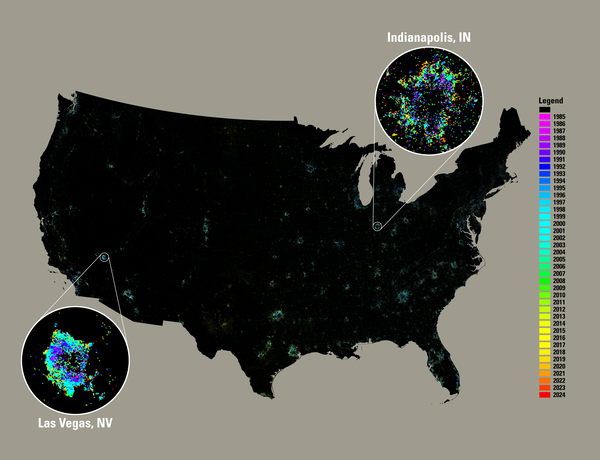
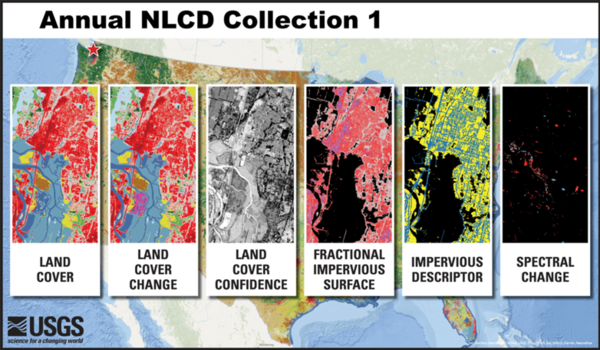
 National Land Cover Database: Improving on a 30-Year Legacy")
 Tool Demo")

 Viewer Tool Demo")