
Remembering Hurricane Sandy Ten Years Later
USGS New England Water Science Center staff deployed storm-tide sensors and rapid deployment gauges ahead of Hurricane Sandy – and measured high water level marks and surveyed for elevation after the historic storm. These vital data are used to improve the accuracy of flood and coastal change models, which are critical to storm preparation and public safety.
It has been 10 years since Hurricane Sandy devastated the Northeastern Atlantic coast causing an estimated $50 billion in damages. Even though Hurricane Sandy downgraded to a post-tropical cyclone before it hit the mid-Atlantic states head-on, it caused immense storm tides, or the total rise in sea level that is pushed inland from high winds. The significant water level increase was because the expansive storm made landfall during a spring high-tide, which is during a full or new moon when gravitational pulls are at their strongest.
USGS temporarily deployed storm-tide sensors ahead of Sandy, which logged water levels every 30 seconds. These sensors were placed along the coastline in Sandy’s track – from Virginia to Maine.

In addition to USGS’ permanent tidal gauge network to measure and transmit real-time water levels, we also positioned rapid deployment gauges (RDGs) to collect the water-level and climate data in flood-prone areas without permanent gauges.
After the surge and winds subsided, USGS retrieved the storm-tide sensors, RDGs, and measured high water level marks.
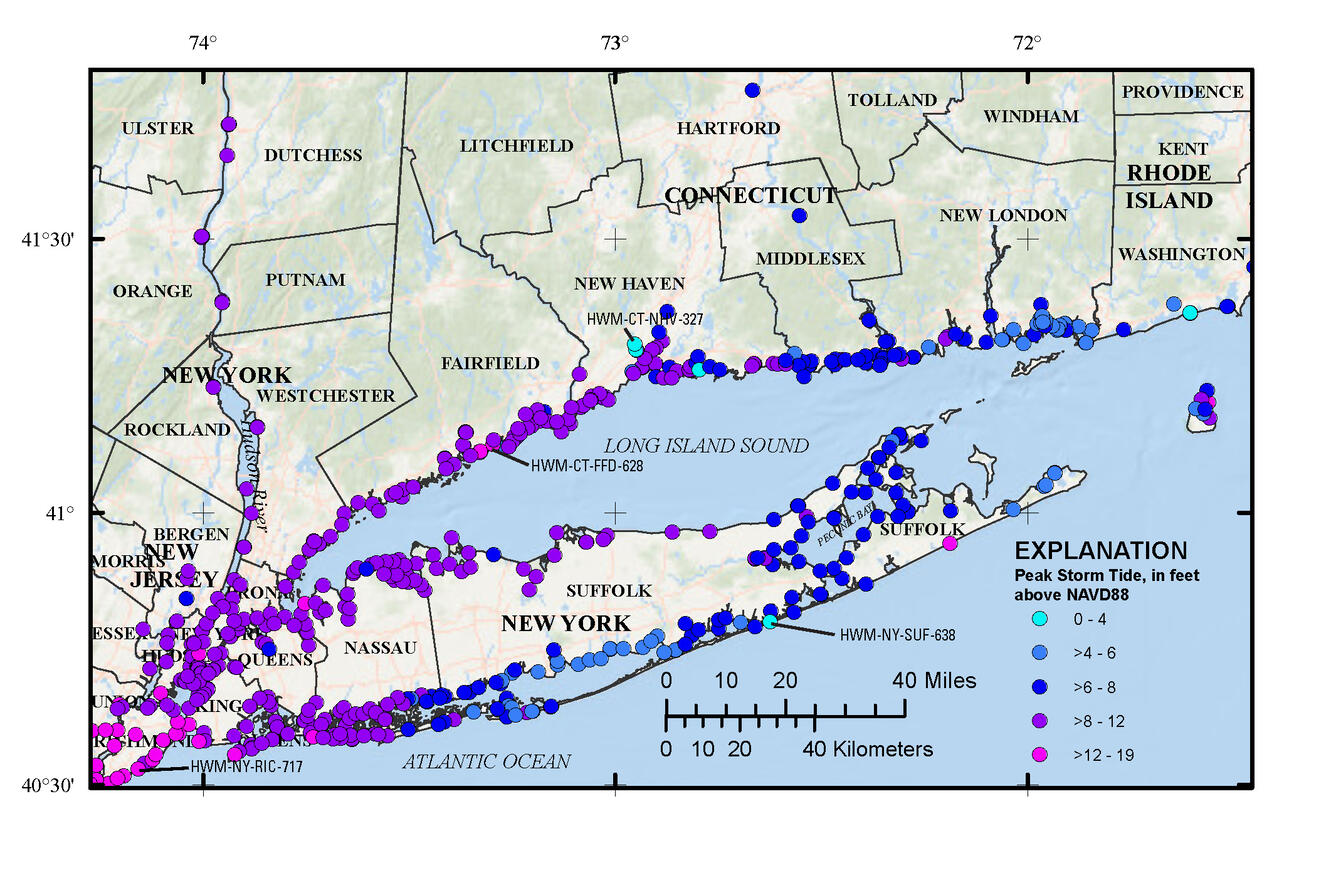
In New England, these data recorded the highest storm-tide levels in Connecticut with peak inundation averaging between 8 to 12 feet on the western end of Long Island Sound in Fairfield and New Haven Counties. However, the Atlantic coastline of New England also experienced significant flooding. Sensors recorded storm-tide elevations of up to 7-to-8 feet on Cape Cod and up through to Ipswich County in Massachusetts. Eastern Connecticut and Rhode Island saw lower storm tides, on average, between 6 to 8 feet.

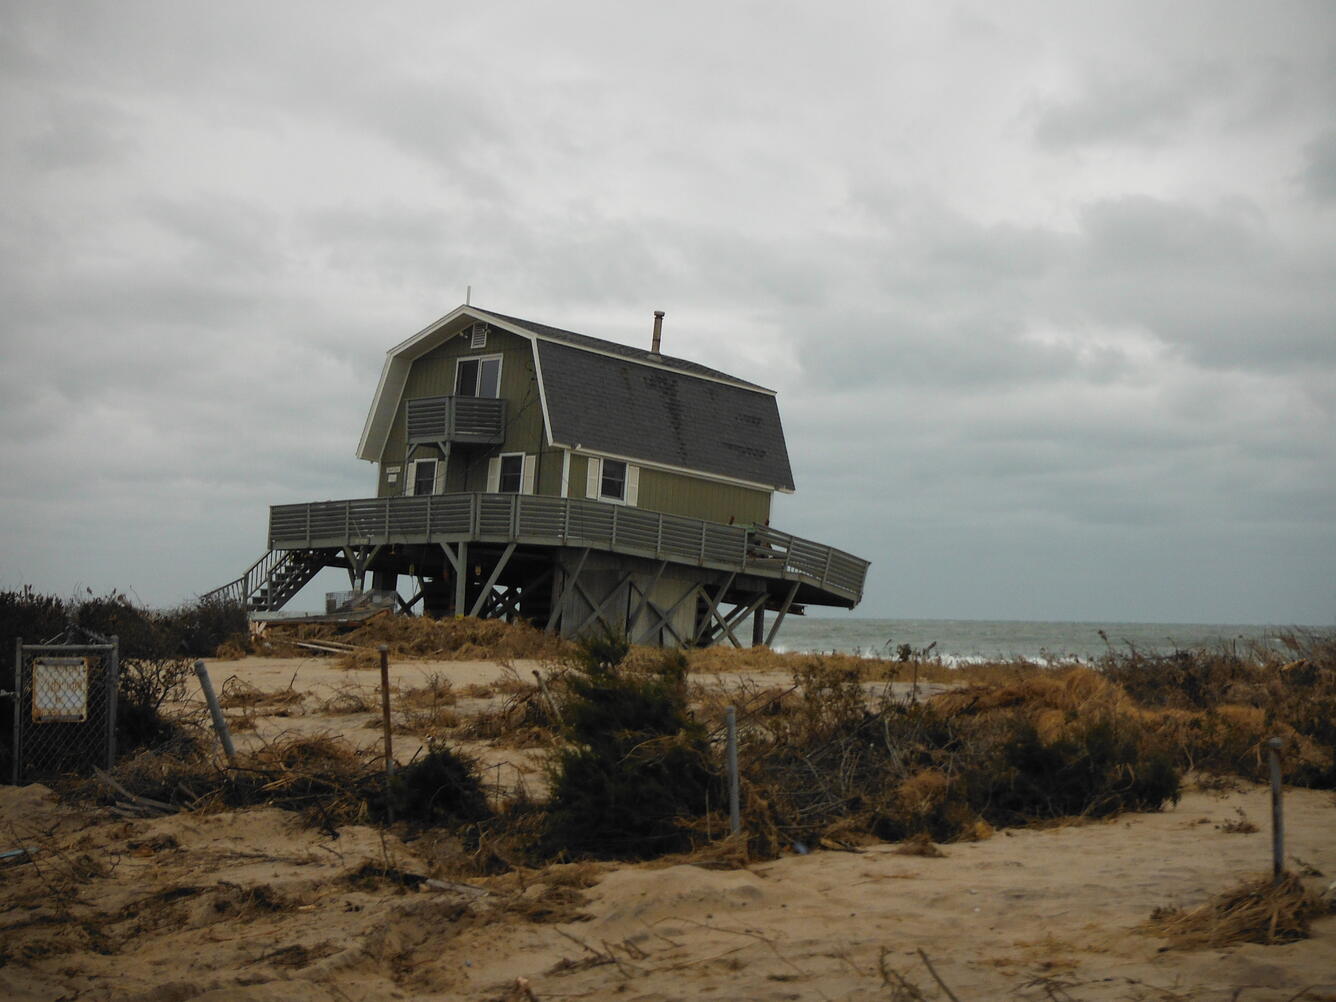
Damages from flooding and wave impact were significant along the coast, damaging homes, commercial buildings, boats, motor vehicles, and infrastructure such as piers, boardwalks, bridges, roads, and sidewalks.
Beyond the coastline, Sandy’s storm surge raised river water levels far inland – with the Connecticut River in Hartford, Connecticut rising by 4 feet.
After Hurricane Sandy, USGS received $43.2 million in supplemental funding to launch research projects and to expand storm-tide data collection efforts, processing, and accessibility. The USGS Water Mission Area used a portion of this money to develop the Flood Event Viewer, a map that displays all data associated with large flood events, and the Short-Term Network, which archives and processes these data for use in flood and coastal change modeling and flood insurance mapping.
The immense storm-tide of Sandy prompted USGS to expand storm-tide sensor usage by providing Water Science Centers with a greater number of sensors. USGS established a large network of pre-identified sites where the storm-tide sensors could be placed ahead of a large storm. These locations are pre-surveyed for elevation and equipped with permanent metal brackets for easy sensor deployment and retrieval. Additionally, these storm-tide sensors can record many observations per second, rather than taking measurements at 30-second intervals as they did before, and during, Hurricane Sandy.
The USGS New England Water Science Center will continue to collect comprehensive meteorological and water level data to other USGS staff and partner agencies to improve storm forecasting, inform communities about the probabilities of coastal change, guide emergency management and public safety, and to estimate economic and ecological consequences of large storm events like Hurricane Sandy.
Learn more about how USGS brings diverse scientific expertise to understanding powerful storms like hurricanes.
Related

Hurricane Sandy in New England
A look back at Hurricane Sandy damage and work conducted before and after the storm by the USGS New England Water Science Center.
Related
Hurricane Sandy in New England
A look back at Hurricane Sandy damage and work conducted before and after the storm by the USGS New England Water Science Center.
Get Our News
These items are in the RSS feed format (Really Simple Syndication) based on categories such as topics, locations, and more. You can install and RSS reader browser extension, software, or use a third-party service to receive immediate news updates depending on the feed that you have added. If you click the feed links below, they may look strange because they are simply XML code. An RSS reader can easily read this code and push out a notification to you when something new is posted to our site.