The potential vulnerability of a particular stretch of coast can be assessed using a conceptual model that scales the impacts of storms on barrier islands.
Overview
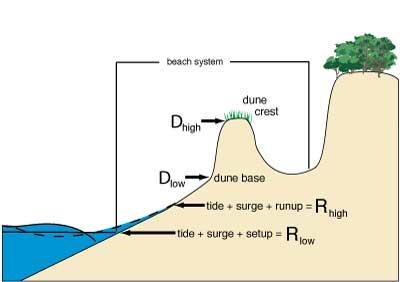
The impact of a storm on a barrier island is dependent not only on the magnitude of storm characteristics, such as storm surge and waves, but also on the elevation of the barrier island at landfall, such as the line of dunes paralleling the shore that act as the coast's first line of defense. Stretches of coast with very low dunes are potentially more susceptible during storms to extreme coastal change than those with higher dunes.
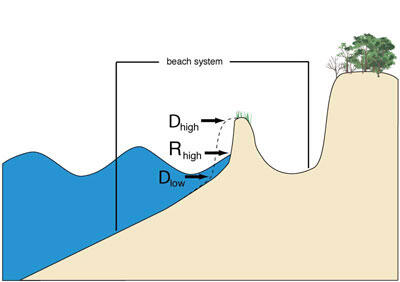
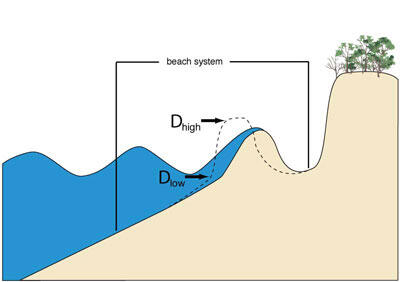
The potential vulnerability of a particular stretch of coast can be assessed using a conceptual model that scales the impacts of storms on barrier islands (Sallenger, 2000). Within the model, the elevation of storm-induced water levels (Rhigh and Rlow), including storm surge, astronomical tide, and wave runup, are compared to measurements of local dune morphology such as the elevation of the dune crest and toe, (Dhigh and Dlow).
The hurricane-induced water levels (Rhigh and Rlow) are the highest reaches of the waves on the beach during a the storm. By considering these water levels relative to coastal elevations Dhigh and Dlow, the crest and base of the dune, four storm impact regimes can be defined for a specific area of the coast:
Swash: Total water levels are lower than the dune toe (Rhigh < Dlow)
Collision: Total water levels exceed the dune toe (Dlow < Rhigh < Dhigh)
Overwash: Total water levels exceed the dune crest (Rhigh > Dhigh)
Inundation: Storm surge and tide exceed the dune crest (Rlow > Dhigh)
Within each of these regimes, the nature and magnitude of coastal change are expected to be unique.

Swash Regime
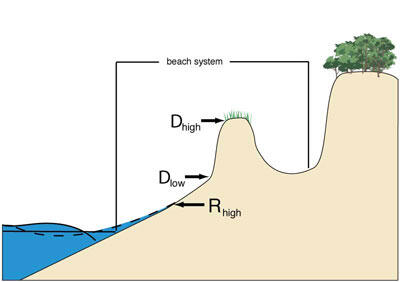
Minimal Impacts of the Swash Regime
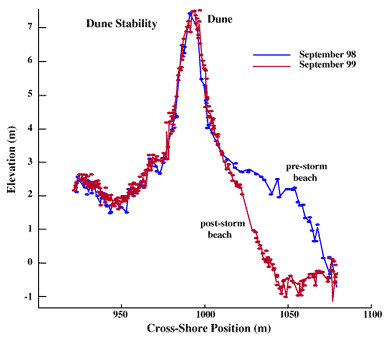
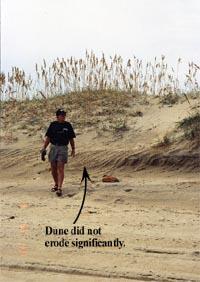
During Hurricane Dennis (1999), at this location, wave runup was confined to the beach. The beach eroded but the dune was untouched (see photo and compared cross-section above). Most of the eroded sand returned to the beach in the weeks to months following Hurricane Dennis (1999).
Collision Regime
Dune Erosion During the Collision Regime
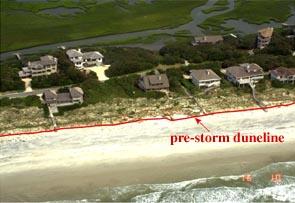
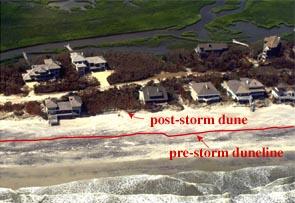
Below are a pair of before and after Hurricane Fran photographs show that the system was in Collision Regime, with significant dune retreat.
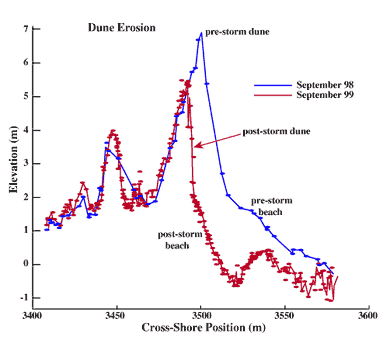
Above are cross-sections of lidar data showing dune retreat of 20 meters during Hurricane Dennis (1999).
Overwash Regime
Impacts of the Overwash Regime
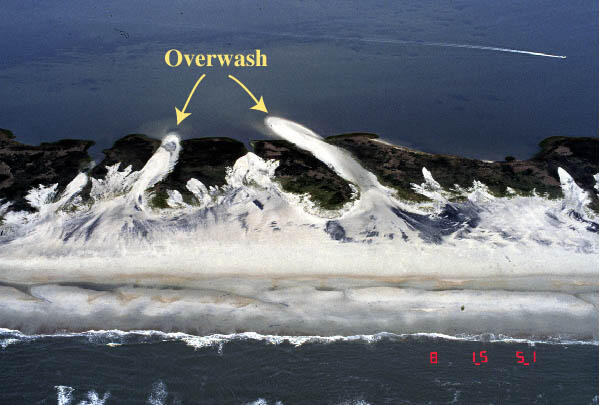
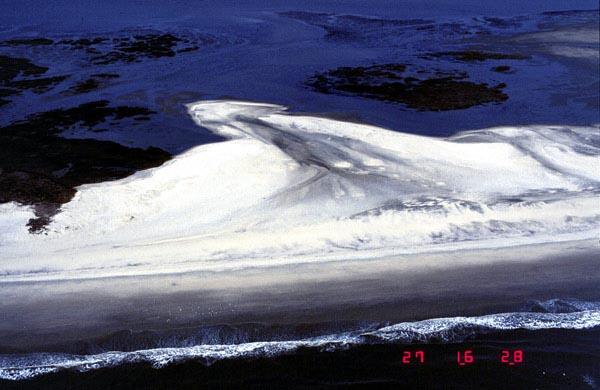
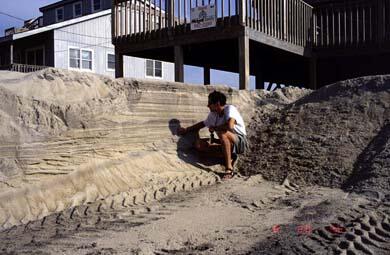
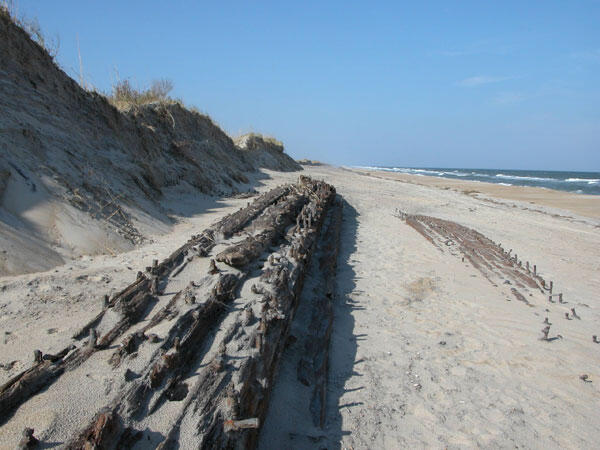
Above are overwash deposits near Rodanthe, North Carolina, after Hurricane Dennis (1999). The sand was transported landward by wave runup overtopping the dune. In both photographs at right, wave runup overtopped the highest part of the system during a storm, resulting in net sand transport landward forming overwash fans.
Inundation Regime
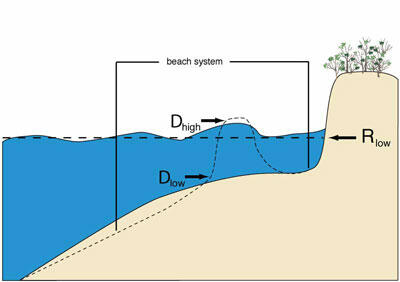
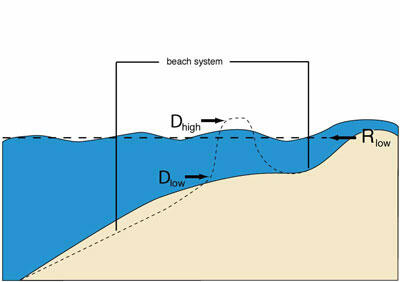
Catastrophic Impacts of the Inundation Regime
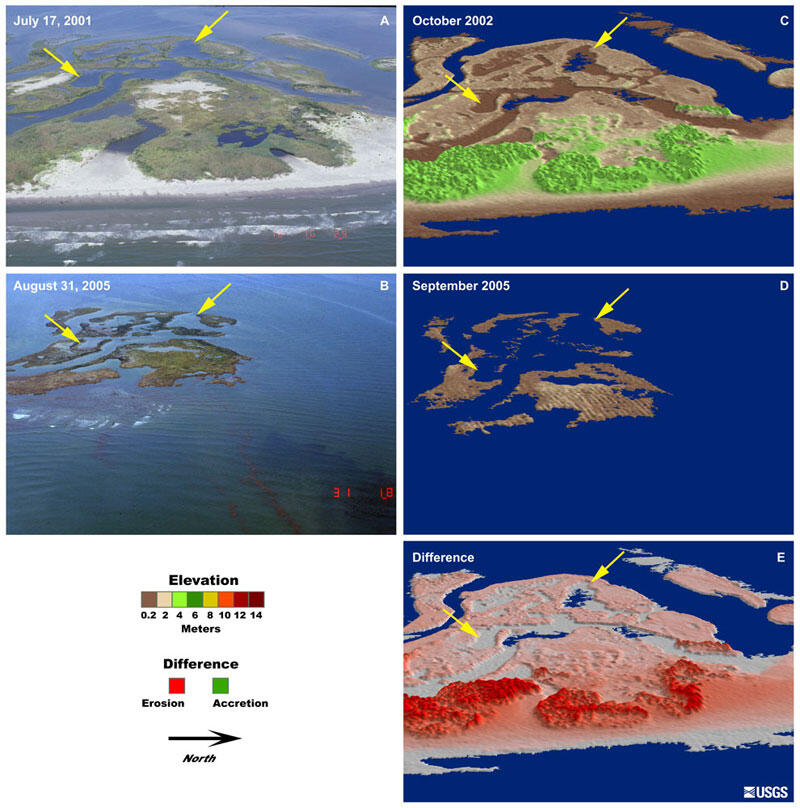
On August 29, 2005, Hurricane Katrina made landfall as a category-3 storm over the Mississippi Delta in Louisiana. This strong storm approached the coast with category-4 strength winds, building large waves and record-levels of storm surge. Aerial video, still photography, and laser altimetry surveys of post-storm beach conditions were collected August 31 and September 1, 2005. Comparisons of post-storm data with earlier surveys were used to show the nature, magnitude, and spatial variability of coastal changes such as beach erosion, overwash deposition, and island breaching.
Louisiana's Chandeleur Islands are an undeveloped, north-south oriented chain of barriers located approximately 110 km east of the city of New Orleans and 70 km east of Katrina's path. These low-lying barrier islands were totally stripped of sand, heavily fragmented by large waves and storm surge, and completely inundated during the storm.
First Line of Defense (Dhigh)
The vulnerability of a barrier island to storm overwash and inundation is determined, in part, by the elevation of the 'first line of defense,' or Dhigh. On a natural beach system, this is either the first dune ridge or, in the absence of a dune, the beach berm. For areas that have been heavily engineered with shore-parallel coastal defense structures (e.g. seawalls), the top of the structure becomes the 'first line of defense.' These features, both natural and engineered, act as a first line of defense for inland areas during storms by protecting them from waves and surge.
The spatial variability of the dune crest plays an important role in making some areas of the coast more vulnerable to hurricane-induced coastal change than other areas. From lidar topographic surveys, detailed measurements of beach topography have been collected along the Nation's coastlines. From these high-resolution surveys, the locations and elevations of Dhigh are measured.
Measuring (Dhigh)
A quantitative method has been developed to extract the location and elevation of Dhigh from lidar surveys. The method follows a set of fixed rules and processes in order to locate Dhigh. This is an objective process, meaning that if it is repeated multiple times, the answers will always be the same.
The complex algorithm is simplified below in order to illustrate the basic principles of this objective technique:
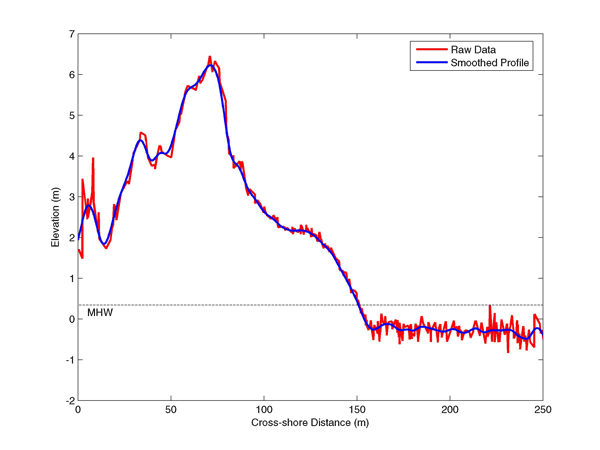
Step 1: A cross-section of lidar data is extracted from the survey, creating a profile view of the beach and dune. In order to eliminate small variations in elevation, the profile is mathematically smoothed.
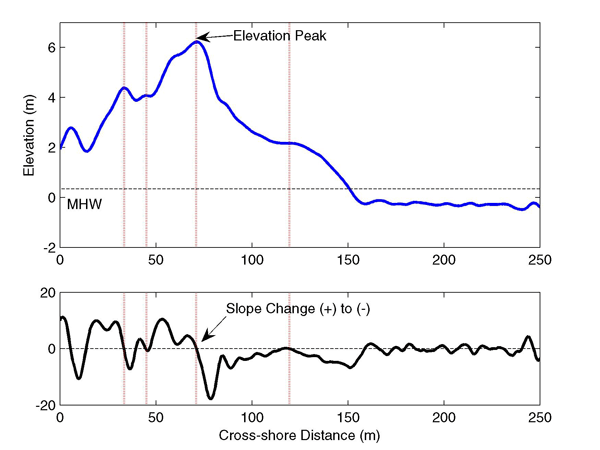
Step 2: Slope is calculated between adjacent data points across the width of the cross section. Elevation peaks are identified based on changes in the direction of slope (positive to negative).
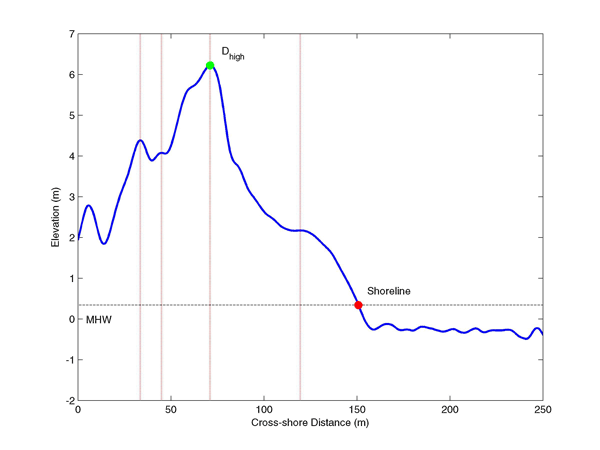
Step 3: Using established mathematical methods (Stockdon et al., 2002), the shoreline is located. Dhigh is the first elevation peak landward of the shoreline.
In the absence of a dune, Dhigh is located at the berm crest. The mathematical methods for locating the berm crest are nearly identical.
An alternative, more subjective method for locating the dune crest and toe is based on gridded, digital elevation models of lidar data. In this method, the location of the dune crest and toe are first digitized by a user and then refined using GIS-based algorithms. For more information on that technique, see the following publication:
Elko, N., Sallenger, A., Guy, K., Stockdon, H. and Morgan, K., 2002. Barrier Island Elevations Relevant to Potential Storm Impacts: 1. Techniques. USGS Open File Report 02-287.
Dhigh Maps
The maps below illustrate the elevation of Dhigh, or the 'first line of defense,' along the South Atlantic and Gulf coasts. Extensive spatial variability in elevation can be observed. Darker red shades indicate relatively low elevations and a corresponding high vulnerability to overwash and inundation. Lighter red shades indicate high, well-developed dunes and relatively low vulnerability to overtopping and net coastal change.
North Carolina
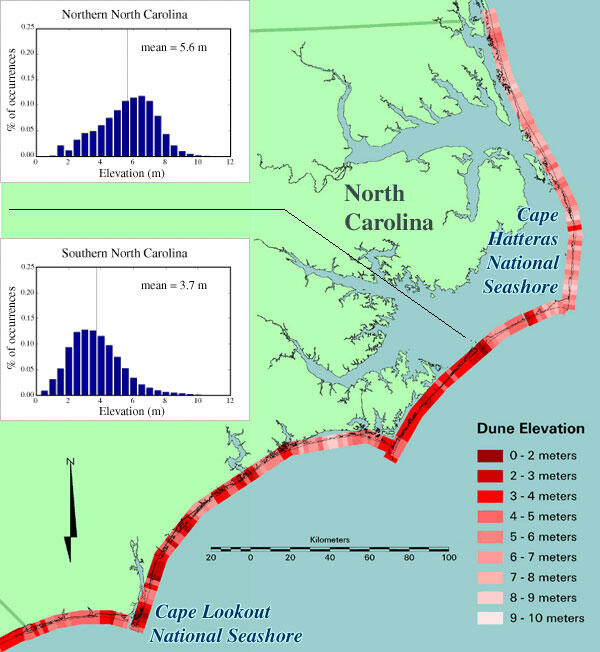
Map of dune elevation for coastal North Carolina. On the left side of the map are histograms showing the distribution of these 'first line of defense' elevations, one for northern North Carolina and one for southern North Carolina.
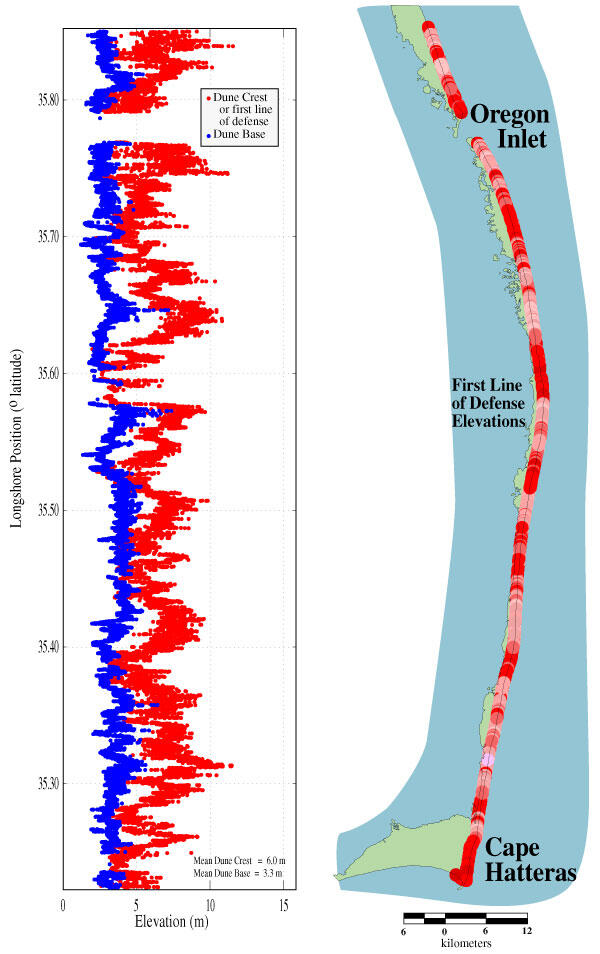
Graph of the elevations of the dune crest and the dune base along Cape Hatteras National Seashore. The gap in data near the top of the graph corresponds with the position of Oregon Inlet. Note the spatial variability along the coast. Lower first line of defense elevations (red) are vulnerable to overwash and inundation regimes. Coasts with lower dune base elevations (blue) are vulnerable to the collision regime and dune retreat. The dune elevation map to the right of the graph covers the same stretch of the Cape Hatteras National Seashore and the vertical scale of dune elevation corresponds to the North Carolina map.
South Carolina
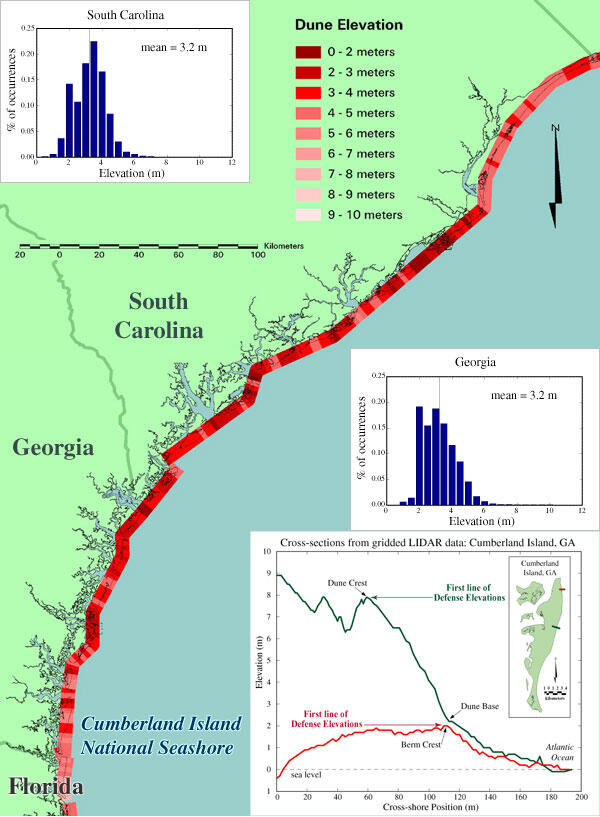
Map of dune elevation for coastal South Carolina and Georgia. On the either side of the map are histograms showing the distribution of these 'first line of defense' elevations, one for South Carolina and one for Georgia. An additional plot of cross-sections produced from gridded lidar data illustrates differences in vulnerability along Cumberland Island National Seashore (see bottom right hand corner of map). The first line of defense elevation of the red cross-section is nearly 6 meters below the elevation of the dark green cross-section.
Florida
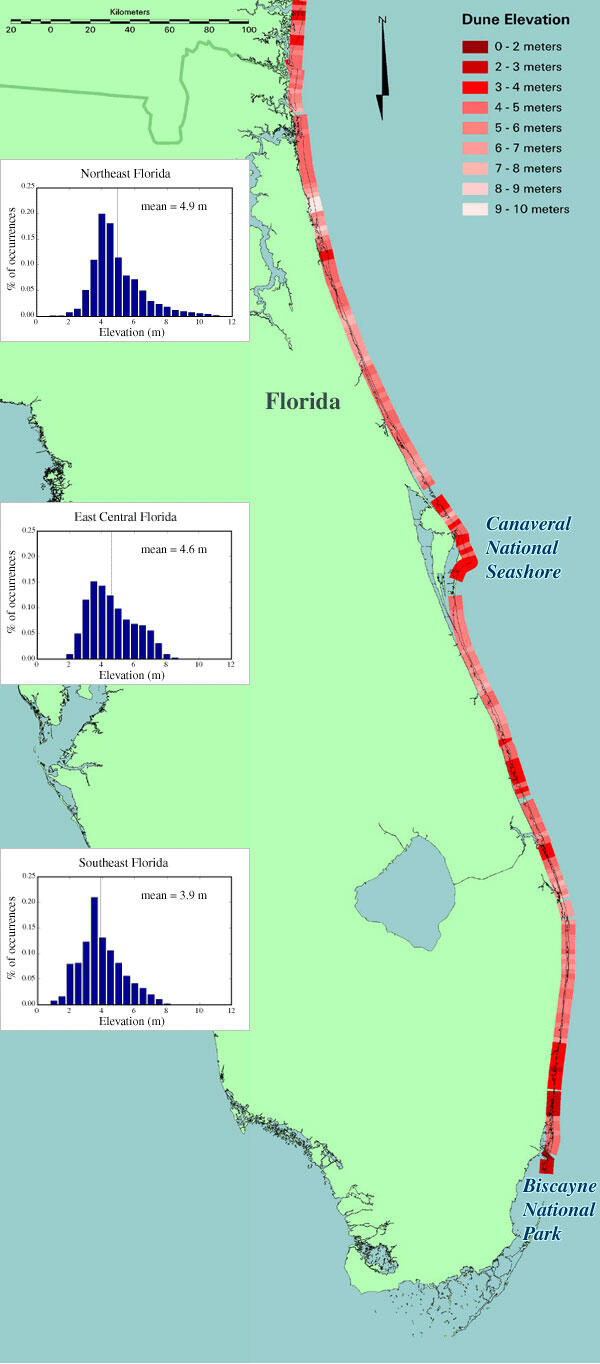
Map of the 'first line of defense' elevations for the eastern coast of Florida. On the left of the map are histograms showing the distribution of these elevations, one for northeastern Florida, one for east central Florida, and one for southeastern Florida.
Northern Gulf of Mexico
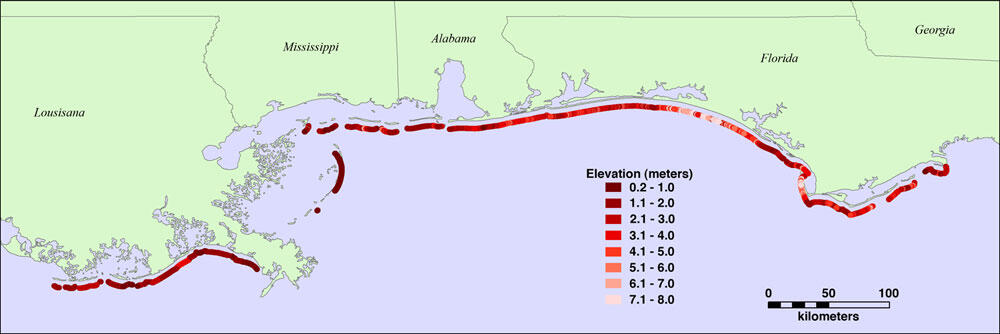
Map of Dhigh, elevations for the barrier islands in the northern Gulf of Mexico (Louisiana, Mississippi, Alabama, and Florida's Panhandle). Low elevations, less than 2 m, make Louisiana's barrier beaches vulnerable to extreme coastal change during hurricanes.
Storm-Induced Water Levels (Rhigh and Rlow)
Estimates of hurricane-induced water levels, Rlow and Rhigh, are necessary for predicting the potential coastal change during an approaching hurricane. Rhigh is maximum water-level elevation expected during a hurricane and includes the astronomical tide, storm surge, and wave runup. Rlow is an effective still-water level during a storm and is composed of the astronomical tide, storm surge and wave setup.
Storm Surge
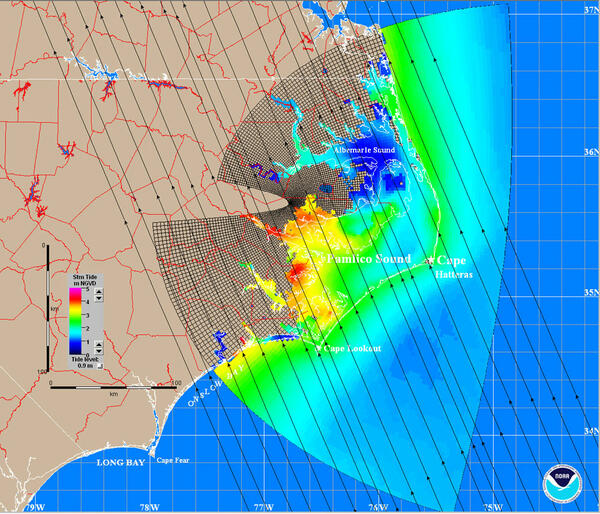
Storm surge is the temporary rise in water level due primarily to winds and pressure within a hurricane. In order to use the storm-impact scaling model in a predictive model, the elevation of surge for the five hurricane categories is modeled by the National Hurricane Center using the NOAA SLOSH (Sea, Lake and Overland Surges from Hurricanes) model, a real-time forecast model for hurricane-induced water levels for the Gulf and Atlantic coasts (see figure at right). The numerical model is based on linearized, depth-integrated equations of motion and continuity (Jarvinen and Lawrence, 1985). Changes in maximum surge elevations are forced by time-varying wind-stress and pressure gradient forces which depend on the hurricane's location, minimum pressure, and size measured from the eyewall out to the location of maximum winds (Jarvinen and Lawrence, 1985). The SLOSH model does not incorporate astronomical tides, wave runup or setup; however, astronomical tides are included in the final results (Houston et al., 1999). While the results are location specific, accounting for local water depths, proximity to bays and river, etc., the results are accurate to ± 20% of the calculated value (2004). Error in SLOSH values can also arise from differences between the parametric wind models which force SLOSH and the hurricane's actual wind field (Houston et al., 1999).
Wave Runup and Setup
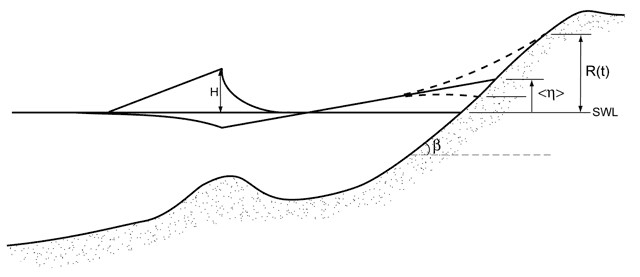
Wave runup (R(t)) is the time-varying fluctuation of water-level elevation at the shoreline due to wave breaking (see figure below). Wave setup (η), the time-averaged water level, is the super-elevation of still water at the shoreline, again due to wave breaking. The magnitude of both runup and setup are related to offshore wave period, wave height (H), and foreshore beach slope (β). The elevation of wave runup and setup are calculated from modeled offshore wave conditions using field-data-based empirical parameterizations (Stockdon, et al., 2006). During storm conditions, the wave runup and setup can double the elevation of water levels at the coast beyond that due to storm surge alone.
References
NOAA, 2004. Hurricane Preparedness. National Centers for Environmental Prediction, National Hurricane Center.
Houston, S.H., Shaffer, W.A., Powell, M.D. and Chen, J., 1999. Comparisons of HRD and SLOSH surface wind fields in hurricanes: Implications for storm surge modeling. Weather and Forecasting, 14: 671-686.
Jarvinen, B.R. and Lawrence, M.B., 1985. An evaluation of the SLOSH storm surge model. Bulletin of the American Meteorological Society, 66(11): 1408-1411.
Stockdon, H.F., R.A. Holman, P.A. Howd, and A.H. Sallenger, 2006. Empirical parameterization of setup, swash, and runup, Coastal Engineering, 53(7), pp. 573-588.
Below are other science projects associated with this project.
Forecasting Coastal Change
Storm-Induced Coastal Change
Scenario-Based Assessments for Coastal Change Hazard Forecasts
Storm-Induced Coastal Processes
Below are data or web applications associated with this project.
Total Water Level and Coastal Change Forecast Viewer
Below are publications associated with this research.
On the use of wave parameterizations and a storm impact scaling model in National Weather Service Coastal Flood and decision support operations
Observations of wave runup, setup, and swash on natural beaches
Empirical parameterization of setup, swash, and runup
Barrier island elevations relevant to potential storm impacts; 1, Techniques
Barrier island elevations relevant to potential storm impacts: 2, South Atlantic
Below are data or web applications associated with this project.
Coastal Change Hazards Portal
The potential vulnerability of a particular stretch of coast can be assessed using a conceptual model that scales the impacts of storms on barrier islands.
Overview

The impact of a storm on a barrier island is dependent not only on the magnitude of storm characteristics, such as storm surge and waves, but also on the elevation of the barrier island at landfall, such as the line of dunes paralleling the shore that act as the coast's first line of defense. Stretches of coast with very low dunes are potentially more susceptible during storms to extreme coastal change than those with higher dunes.
The potential vulnerability of a particular stretch of coast can be assessed using a conceptual model that scales the impacts of storms on barrier islands (Sallenger, 2000). Within the model, the elevation of storm-induced water levels (Rhigh and Rlow), including storm surge, astronomical tide, and wave runup, are compared to measurements of local dune morphology such as the elevation of the dune crest and toe, (Dhigh and Dlow).
The hurricane-induced water levels (Rhigh and Rlow) are the highest reaches of the waves on the beach during a the storm. By considering these water levels relative to coastal elevations Dhigh and Dlow, the crest and base of the dune, four storm impact regimes can be defined for a specific area of the coast:
Swash: Total water levels are lower than the dune toe (Rhigh < Dlow)
Collision: Total water levels exceed the dune toe (Dlow < Rhigh < Dhigh)
Overwash: Total water levels exceed the dune crest (Rhigh > Dhigh)
Inundation: Storm surge and tide exceed the dune crest (Rlow > Dhigh)
Within each of these regimes, the nature and magnitude of coastal change are expected to be unique.

Swash Regime

Minimal Impacts of the Swash Regime


During Hurricane Dennis (1999), at this location, wave runup was confined to the beach. The beach eroded but the dune was untouched (see photo and compared cross-section above). Most of the eroded sand returned to the beach in the weeks to months following Hurricane Dennis (1999).
Collision Regime

Dune Erosion During the Collision Regime

Below are a pair of before and after Hurricane Fran photographs show that the system was in Collision Regime, with significant dune retreat.


Above are cross-sections of lidar data showing dune retreat of 20 meters during Hurricane Dennis (1999).
Overwash Regime

Impacts of the Overwash Regime


Above are overwash deposits near Rodanthe, North Carolina, after Hurricane Dennis (1999). The sand was transported landward by wave runup overtopping the dune. In both photographs at right, wave runup overtopped the highest part of the system during a storm, resulting in net sand transport landward forming overwash fans.
Inundation Regime


Catastrophic Impacts of the Inundation Regime
On August 29, 2005, Hurricane Katrina made landfall as a category-3 storm over the Mississippi Delta in Louisiana. This strong storm approached the coast with category-4 strength winds, building large waves and record-levels of storm surge. Aerial video, still photography, and laser altimetry surveys of post-storm beach conditions were collected August 31 and September 1, 2005. Comparisons of post-storm data with earlier surveys were used to show the nature, magnitude, and spatial variability of coastal changes such as beach erosion, overwash deposition, and island breaching.
Louisiana's Chandeleur Islands are an undeveloped, north-south oriented chain of barriers located approximately 110 km east of the city of New Orleans and 70 km east of Katrina's path. These low-lying barrier islands were totally stripped of sand, heavily fragmented by large waves and storm surge, and completely inundated during the storm.

First Line of Defense (Dhigh)
The vulnerability of a barrier island to storm overwash and inundation is determined, in part, by the elevation of the 'first line of defense,' or Dhigh. On a natural beach system, this is either the first dune ridge or, in the absence of a dune, the beach berm. For areas that have been heavily engineered with shore-parallel coastal defense structures (e.g. seawalls), the top of the structure becomes the 'first line of defense.' These features, both natural and engineered, act as a first line of defense for inland areas during storms by protecting them from waves and surge.
The spatial variability of the dune crest plays an important role in making some areas of the coast more vulnerable to hurricane-induced coastal change than other areas. From lidar topographic surveys, detailed measurements of beach topography have been collected along the Nation's coastlines. From these high-resolution surveys, the locations and elevations of Dhigh are measured.
Measuring (Dhigh)
A quantitative method has been developed to extract the location and elevation of Dhigh from lidar surveys. The method follows a set of fixed rules and processes in order to locate Dhigh. This is an objective process, meaning that if it is repeated multiple times, the answers will always be the same.
The complex algorithm is simplified below in order to illustrate the basic principles of this objective technique:
Step 1: A cross-section of lidar data is extracted from the survey, creating a profile view of the beach and dune. In order to eliminate small variations in elevation, the profile is mathematically smoothed.

Step 2: Slope is calculated between adjacent data points across the width of the cross section. Elevation peaks are identified based on changes in the direction of slope (positive to negative).

Step 3: Using established mathematical methods (Stockdon et al., 2002), the shoreline is located. Dhigh is the first elevation peak landward of the shoreline.

In the absence of a dune, Dhigh is located at the berm crest. The mathematical methods for locating the berm crest are nearly identical.
An alternative, more subjective method for locating the dune crest and toe is based on gridded, digital elevation models of lidar data. In this method, the location of the dune crest and toe are first digitized by a user and then refined using GIS-based algorithms. For more information on that technique, see the following publication:
Elko, N., Sallenger, A., Guy, K., Stockdon, H. and Morgan, K., 2002. Barrier Island Elevations Relevant to Potential Storm Impacts: 1. Techniques. USGS Open File Report 02-287.
Dhigh Maps
The maps below illustrate the elevation of Dhigh, or the 'first line of defense,' along the South Atlantic and Gulf coasts. Extensive spatial variability in elevation can be observed. Darker red shades indicate relatively low elevations and a corresponding high vulnerability to overwash and inundation. Lighter red shades indicate high, well-developed dunes and relatively low vulnerability to overtopping and net coastal change.
North Carolina
Map of dune elevation for coastal North Carolina. On the left side of the map are histograms showing the distribution of these 'first line of defense' elevations, one for northern North Carolina and one for southern North Carolina.

Graph of the elevations of the dune crest and the dune base along Cape Hatteras National Seashore. The gap in data near the top of the graph corresponds with the position of Oregon Inlet. Note the spatial variability along the coast. Lower first line of defense elevations (red) are vulnerable to overwash and inundation regimes. Coasts with lower dune base elevations (blue) are vulnerable to the collision regime and dune retreat. The dune elevation map to the right of the graph covers the same stretch of the Cape Hatteras National Seashore and the vertical scale of dune elevation corresponds to the North Carolina map.

South Carolina
Map of dune elevation for coastal South Carolina and Georgia. On the either side of the map are histograms showing the distribution of these 'first line of defense' elevations, one for South Carolina and one for Georgia. An additional plot of cross-sections produced from gridded lidar data illustrates differences in vulnerability along Cumberland Island National Seashore (see bottom right hand corner of map). The first line of defense elevation of the red cross-section is nearly 6 meters below the elevation of the dark green cross-section.

Florida
Map of the 'first line of defense' elevations for the eastern coast of Florida. On the left of the map are histograms showing the distribution of these elevations, one for northeastern Florida, one for east central Florida, and one for southeastern Florida.

Northern Gulf of Mexico
Map of Dhigh, elevations for the barrier islands in the northern Gulf of Mexico (Louisiana, Mississippi, Alabama, and Florida's Panhandle). Low elevations, less than 2 m, make Louisiana's barrier beaches vulnerable to extreme coastal change during hurricanes.

Storm-Induced Water Levels (Rhigh and Rlow)
Estimates of hurricane-induced water levels, Rlow and Rhigh, are necessary for predicting the potential coastal change during an approaching hurricane. Rhigh is maximum water-level elevation expected during a hurricane and includes the astronomical tide, storm surge, and wave runup. Rlow is an effective still-water level during a storm and is composed of the astronomical tide, storm surge and wave setup.
Storm Surge

Storm surge is the temporary rise in water level due primarily to winds and pressure within a hurricane. In order to use the storm-impact scaling model in a predictive model, the elevation of surge for the five hurricane categories is modeled by the National Hurricane Center using the NOAA SLOSH (Sea, Lake and Overland Surges from Hurricanes) model, a real-time forecast model for hurricane-induced water levels for the Gulf and Atlantic coasts (see figure at right). The numerical model is based on linearized, depth-integrated equations of motion and continuity (Jarvinen and Lawrence, 1985). Changes in maximum surge elevations are forced by time-varying wind-stress and pressure gradient forces which depend on the hurricane's location, minimum pressure, and size measured from the eyewall out to the location of maximum winds (Jarvinen and Lawrence, 1985). The SLOSH model does not incorporate astronomical tides, wave runup or setup; however, astronomical tides are included in the final results (Houston et al., 1999). While the results are location specific, accounting for local water depths, proximity to bays and river, etc., the results are accurate to ± 20% of the calculated value (2004). Error in SLOSH values can also arise from differences between the parametric wind models which force SLOSH and the hurricane's actual wind field (Houston et al., 1999).
Wave Runup and Setup
Wave runup (R(t)) is the time-varying fluctuation of water-level elevation at the shoreline due to wave breaking (see figure below). Wave setup (η), the time-averaged water level, is the super-elevation of still water at the shoreline, again due to wave breaking. The magnitude of both runup and setup are related to offshore wave period, wave height (H), and foreshore beach slope (β). The elevation of wave runup and setup are calculated from modeled offshore wave conditions using field-data-based empirical parameterizations (Stockdon, et al., 2006). During storm conditions, the wave runup and setup can double the elevation of water levels at the coast beyond that due to storm surge alone.

References
NOAA, 2004. Hurricane Preparedness. National Centers for Environmental Prediction, National Hurricane Center.
Houston, S.H., Shaffer, W.A., Powell, M.D. and Chen, J., 1999. Comparisons of HRD and SLOSH surface wind fields in hurricanes: Implications for storm surge modeling. Weather and Forecasting, 14: 671-686.
Jarvinen, B.R. and Lawrence, M.B., 1985. An evaluation of the SLOSH storm surge model. Bulletin of the American Meteorological Society, 66(11): 1408-1411.
Stockdon, H.F., R.A. Holman, P.A. Howd, and A.H. Sallenger, 2006. Empirical parameterization of setup, swash, and runup, Coastal Engineering, 53(7), pp. 573-588.
Below are other science projects associated with this project.
Forecasting Coastal Change
Storm-Induced Coastal Change
Scenario-Based Assessments for Coastal Change Hazard Forecasts
Storm-Induced Coastal Processes
Below are data or web applications associated with this project.
Total Water Level and Coastal Change Forecast Viewer
Below are publications associated with this research.
On the use of wave parameterizations and a storm impact scaling model in National Weather Service Coastal Flood and decision support operations
Observations of wave runup, setup, and swash on natural beaches
Empirical parameterization of setup, swash, and runup
Barrier island elevations relevant to potential storm impacts; 1, Techniques
Barrier island elevations relevant to potential storm impacts: 2, South Atlantic
Below are data or web applications associated with this project.


