
Average daily water use for the top 3 water use categories in the lower 48 states: thermoelectric power generation, public supply, and crop irrigation.
Images
Discover and download images and data visualizations that support the National and Regional Water Availability Assessments.

Water use map (2020)
Average daily water use for the top 3 water use categories in the lower 48 states: thermoelectric power generation, public supply, and crop irrigation.

The water cycle of the U.S.
In the lower 48 states, nearly 5,000 billion gallons of water fall in the form of precipitation each day. Most of that water re-enters the atmosphere through evapotranspiration, and about a quarter of our daily water input ends up as streamflow to the Atlantic and Pacific Oceans, Canada or the Gulf of Mexico.
In the lower 48 states, nearly 5,000 billion gallons of water fall in the form of precipitation each day. Most of that water re-enters the atmosphere through evapotranspiration, and about a quarter of our daily water input ends up as streamflow to the Atlantic and Pacific Oceans, Canada or the Gulf of Mexico.
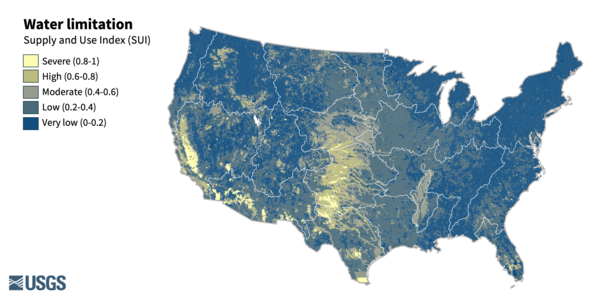
Water limitation (2010-2020)
Water limitation across the lower 48. Water limitation is measured as the Supply and Use Index (SUI) which represents the imbalance between water supply and demand. A higher SUI indicates a greater proportion of supply being used.
Water limitation across the lower 48. Water limitation is measured as the Supply and Use Index (SUI) which represents the imbalance between water supply and demand. A higher SUI indicates a greater proportion of supply being used.

Sources of Nitrogen across hydrologic regions (total load)
A stacked bar chart showing the sources of Nitrogen across hydrologic regions of CONUS (2010-2020). Colors show the total Nitrogen load contributed from agriculture, atmospheric deposition, natural sources, wastewater, and other human sources.
A stacked bar chart showing the sources of Nitrogen across hydrologic regions of CONUS (2010-2020). Colors show the total Nitrogen load contributed from agriculture, atmospheric deposition, natural sources, wastewater, and other human sources.

Water Use in the U.S. - daily water use
Around 90% of daily water use in the lower 48 United States goes toward crop irrigation, thermoelectric power plants, where freshwater is used in the process of creating energy, and public supply, where water is withdrawn or purchased by a water supplier and delivered to many users. These three uses add up to 224,000 million gallons of freshwater per day.
Around 90% of daily water use in the lower 48 United States goes toward crop irrigation, thermoelectric power plants, where freshwater is used in the process of creating energy, and public supply, where water is withdrawn or purchased by a water supplier and delivered to many users. These three uses add up to 224,000 million gallons of freshwater per day.

Consumptive water use
Not all water withdrawals are returned to the local environment. Some water is lost because it is evaporated, transpired, incorporated into products or crops, or otherwise made unavailable for immediate use.
Not all water withdrawals are returned to the local environment. Some water is lost because it is evaporated, transpired, incorporated into products or crops, or otherwise made unavailable for immediate use.

Sources of Nitrogen across hydrologic regions (percent)
A stacked bar chart showing the relative sources of Nitrogen across hydrologic regions of CONUS (2010-2020). Colors show the percent of total Nitrogen load contributed from agriculture, atmospheric deposition, natural sources, wastewater, and other human sources.
A stacked bar chart showing the relative sources of Nitrogen across hydrologic regions of CONUS (2010-2020). Colors show the percent of total Nitrogen load contributed from agriculture, atmospheric deposition, natural sources, wastewater, and other human sources.

Water use 2010-2020 by type
Total water use for the top 3 water use categories: thermoelectric power generation, public supply, and crop irrigation. These three categories make up 90% of all water use in the contiguous United States.
Total water use for the top 3 water use categories: thermoelectric power generation, public supply, and crop irrigation. These three categories make up 90% of all water use in the contiguous United States.

Total water use (2010-2020)
Total water use for the top 3 water use categories: thermoelectric power generation, public supply, and crop irrigation. These three categories make up 90% of all water use in the contiguous United States.
Total water use for the top 3 water use categories: thermoelectric power generation, public supply, and crop irrigation. These three categories make up 90% of all water use in the contiguous United States.

Water supply vs demand 2010-2020
Surface water supply and demand across hydrologic regions (2010-2020). Surface water supply is shown as average surface runoff, and demand reflects consumptive use.
Surface water supply and demand across hydrologic regions (2010-2020). Surface water supply is shown as average surface runoff, and demand reflects consumptive use.

Drinking water aquifers
A simplified drinking water aquifer map of CONUS. Overlapping aquifers are indicated with striping.
A simplified drinking water aquifer map of CONUS. Overlapping aquifers are indicated with striping.

IWAAs national release graphic
Graphic developed for the release of the National Water Availability Assessment in January 2025.
Graphic developed for the release of the National Water Availability Assessment in January 2025.

IWAAs product interdependencies (Media Item)
The three Integrated Water Availability Assessment products are designed to be interdependent:
The three Integrated Water Availability Assessment products are designed to be interdependent:

IWAAs Product Overlap (media item)
The three National Water Availability Assessment products are designed to be interdependent:
The three National Water Availability Assessment products are designed to be interdependent:

IWAAs - levels of water limitations
Water limitation across the lower 48 United States, shown as the average from 2010 to 2020 for each watershed (HUC12). Water limitation levels were based on the surface water supply and use index, which expresses the imbalance between surface water-supply and consumptive use.
Water limitation across the lower 48 United States, shown as the average from 2010 to 2020 for each watershed (HUC12). Water limitation levels were based on the surface water supply and use index, which expresses the imbalance between surface water-supply and consumptive use.