
2011 earthquake swarm map, YNP
By Volcano Hazards Program
2011 (approx.)
Detailed Description
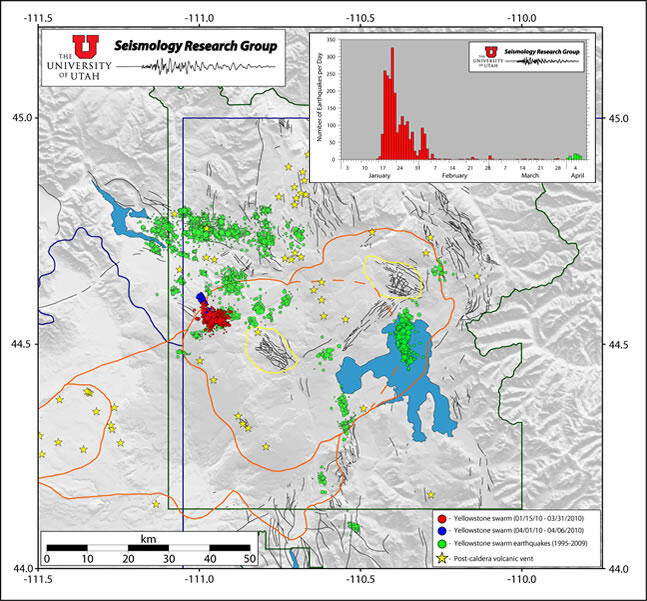
Jan-Feb, 2010 swarm earthquakes in red, April, 2010 earthquakes in blue, previous swarms from 1995-2009 in green, and volcanic vents with yellow stars. Caldera boundaries are shown in orange. Mallard Lake Resurgent dome, to the southwest, and Sourcreek Resurgent dome, to the northeast, are shown with yellow lines. The histogram at the top right shows the number of earthquakes per day from January 15 to April 6, 2010. Image by Jamie Farrell and Robert B. Smith (University of Utah), data from the University of Utah Seismograph Stations.
Sources/Usage
Public Domain.
University of Utah