
Data plots showing Mauna Loa deformation
By Hawaiian Volcano Observatory
2021 (approx.)

Detailed Description
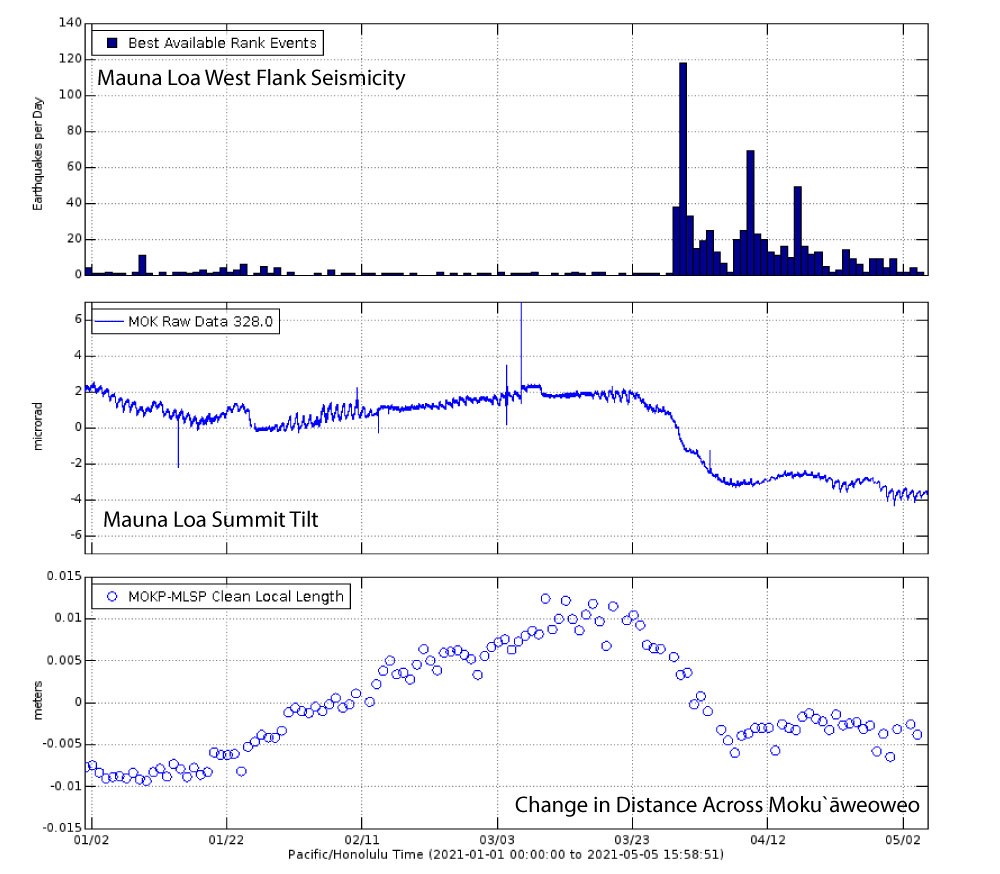
Data plots showing some of the features mentioned in this week’s “Volcano Watch” article. The top panel is a histogram of seismicity on Mauna Loa’s west flank, showing an increase in activity in that region over the past month. The middle panel is a tilt record from a tiltmeter near Mokuʻāweoweo, the change in trend from March 23 to April 5 is the first time a tilt change at Mauna Loa could be ascribed to volcanic changes. The bottom panel show the change in distance across the summit caldera, as measured by GPS. Lengthening of the line indicate expansion of the volcano, and decreases indicate contraction. USGS plots.
Sources/Usage
Public Domain.